IBD Meetup Group Night

Tonight was Investor’s Business Daily Meetup Group night.   Investors all over the world who are interested in IBD trading strategies can meet on the last Wednesday of each month to share their insights on investing and trading.   Tonight, about nine of us met at a local restaurant.   There is a core group of regulars with a few newcomers attending once in a while. Tonight it was all experienced members who are fairly addicted to trading the market.   We all study stock charts, read IBD, and use many of the IBD investing tools.

Tonight’s meeting was different than the other meetings   that I have attended during the past year.   No one circulated piles of charts of promising industries or stocks to buy.   The discussions were subdued and everyone said that no one was making much money trading. They were licking their wounds and lamenting that this   was the worst market in a long time.

Read more

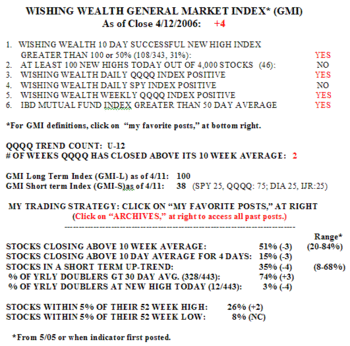
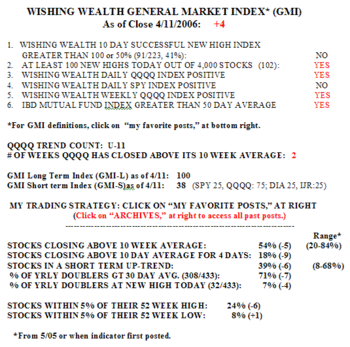
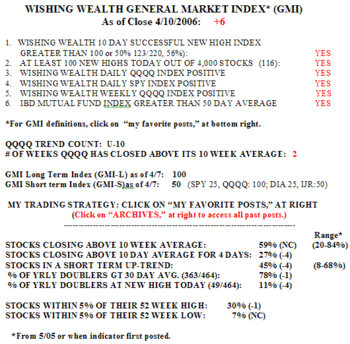
About the General Market Index (GMI)

Index This market just makes you want to scream, doesn’t it?   Now you know why I stay out of sick markets and sold my MHS days ago.   Here is a stock that broke to a new all-time high at the end of March and held up for a few weeks.   It seemed like a good “defensive” stock, being in the management of prescription drug programs.   So what happened today?   It announces quarterly earnings today up 27% but apparently did not boost its profit outlook for the rest of the year.    So what does it do? It declines today 9.12%! This is the type of action one gets in a market that is in a downtrend with few stocks successfully holding new high ground.

Read more

The Interest Rate Index

WishingWealth 10 day successful new high index:   4/25   20; 4/22 19;   4/21    28;   4/20    12

Range since March, 2005:    8-106 (This index counts the number of stocks, of 4,000, that hit a 52 week high 10 days ago and closed today greater than they did 10 days ago.)   With only 20/4000 stocks hitting new highs   and continuing to rise, it would seem to me that this is not the time to buy stocks trading at new highs.   I will wait for a stronger market.   I have a similar index that counts new lows that continue to decline–it is 56 today.   New lows are a better bet than new highs these days.

Housing stocks (and MHS) popped today.   Housing’s   downtrend appears to me to still be intact.   The market’s volume on the rise seems unspectacular.   As I have noted before, I would need to see much more strength before my indicators would signal a turn.   Let’s see what happens after earning are all out.   Remember, all of these earnings represent the past and the market always is looking forward.

I received the following explanation about the short term interest rate index that I highlighted yesterday:   IRX-X data come   from the CBOE symbol IRX-E.   You can get more information on the IRX-X by clicking the link:

Interest Rate Options

As best I can tell, this index tracks the yield of the 13 week treasury bills.   Maybe we should be trading these options–as we saw yesterday, this index sure does trend.   If any readers know more about these options, please email me so I can pass it on.