Monday was better; GMI: +6; CME and GOOG decline; negative trends in housing; FTO, LUFK

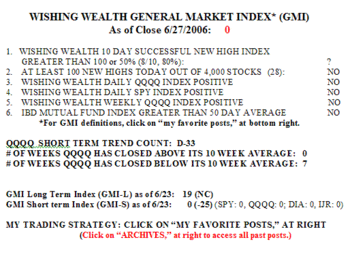
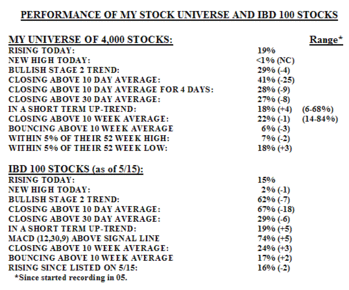
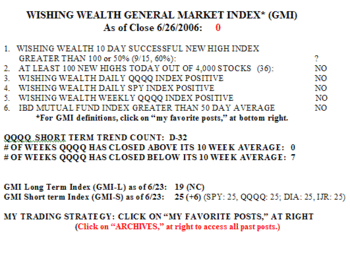
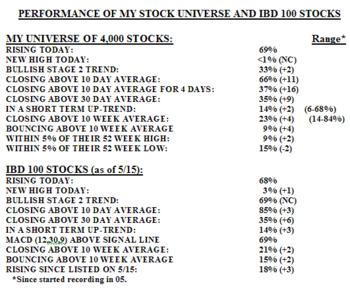
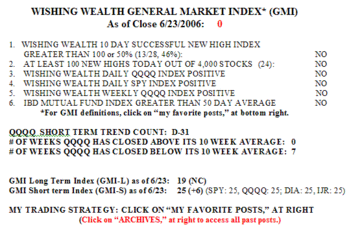
Monday was a better day and the short term stats improved a little.  The GMI remains at +6.  There were 166 successful 10 day new highs and 138 new yearly highs.  There were only 21 new lows in my universe of 4,000 stocks.  Gmi815 While the percentage of stocks above their 10 week averages increased 2 points to 62%, the percentage in a short term up trend declined 2 to 32%.  Between 63%-67% of the Nasdaq 100, S&P 500 and Dow 30 stocks advanced Monday.  The DIA and SPY climbed back above their 10 day averages–a good sign.  The QQQQ closed just below (.06) its 10 day.  Today is a very important day.  If these indexes close below their 10 day I will become more defensive and it will probably only be a short time before the GMI begins to decline.  The key is not to become too bearish as long as the GMI holds.  There is plenty of time for me to go short after the GMI gives the proper signal.

Sunday night I mentioned that CME and GOOG appeared to be weakening.  CME cracked Monday, down 18.96 (-6.5%) and GOOG fell 5.72 (-1.9%).  I don’t like to see the leaders weaken.  Many of the gurus I admire (see Boik’s book at right) have said that after the leaders of the market crack, the whole market is likely to decline.  So I am waiting with a mixture of longs and puts in my IRA.  LUFK and FTO were strong on Monday, and BBY may be bouncing (I own these.) Note also that some of the housing stocks (for example PHM, TOL, HOV)  are showing a negative cross-over of their 10 day average below their 30 day average, for the first time in months. In a few days we will know whether the short term weakening we are seeing will lead to a larger decline, or a resumption of the general market’s advance.  Have a good day.

Please send me your feedback at: silentknight@wishingwealthblog.com.
Back from vacation; GMI still +6; WPM shows below surface weakening; Many bearish cross-overs among leaders; Buying puts

I’m back from vacation—and suffering from jet lag.  But I think it is important to update the GMI and the WPM.  The GMI has not changed since my last post on 7/29 and remains at +6.  However, there are a number of critical signs of weakness in the markets.  Gmi812_1 While there were 159 successful 10 day new highs on Friday, only 35% of the 452 stocks that hit a new high 10 days earlier closed higher on Friday than 10 days earlier.  The 142 new yearly highs in my universe of 4,000 stocks was the least since there were 130 on July 18.  The SPY, QQQQ, and growth mutual fun indicators remain positive.  However, only 59% of stocks closed above their 10 week averages, down from 79% on 7/29 and the percentage of stocks in a short term up-trend declined from 61% to 34%.  Unfortunately, I did not track these indicators the past 2 weeks and cannot estimate the timing of these declines.  The QQQQ up trend is in its 26th day.  However, this index has closed below its 10 day average for the past 6 trading days.  Since this QQQQ rally began on July 8, the index never closed below its 10 day average–until beginning, August 5.  This is a sign that the QQQQ rally has weakened.

This table of the WPM shows what is going on beneath the indexes.  Wpm812_1 While the 5 indexes have remained above their critical 30 day and 30 week moving averages, there has been marked short term deterioration within each of the 5 indexes since I first posted the WPM on 7/22.  For example, only 48% of the S&P 500 stocks are now above their 30 day averages, down from 75%.  In fact, only 42%-50% of the stocks in these 5 indexes closed above their 30 day averages on Friday, compared with 60%-80% on 7/22.  There was little change in the percentage of the stocks in these indexes that remained above their longer term 30 week averages, with the exception of the lagging DIA, which strengthened (57% vs. 47%).

Putting it all together, while the longer term up trend seems to be intact, the short term trend has weakened considerably.  While it is not necessary that this short term weakness will lead to a change in the longer term trend of the market, remember that the short term moving averages, by definition, will always signal a change in trend before the longer term averages.  (The 30 day average changes faster because it measures the last 30 days of trading while the 30 week moving average spans 150 days.)

In my previous post, I showed you a "Naked Chart" of GOOG displaying the 10 and 30 day averages without the prices.  It was clear that the up trend in a stock (GOOG as an example) was clearly shown by the 10 day average’s being consistently above the 30 day average.  Well, over the past 2 weeks many of the leading stocks, including GOOG, have shown a negative cross-over with the 10 day average now being below the 30 day average. Goog812_1 Other stocks showing such bearish cross-overs include:  CME, SHLD, HD, GM, DSL, GDW, FRE, MW, SMTS, CKCM, LDG, HANS, XMSR, NKE.  These are just stocks that I have been watching or trading–there are many more.  When leaders of the market like GOOG, CME, SHLD and HANS all appear to be weakening, it is an omen for the general market worthy of our attention.  I have therefore been cutting back on my longs and am buying puts on some of the stocks listed above.  Time will tell if this is a temporary hiatus in the bull market, or a case of the bear waking from a completed hibernation.  Be careful out there.

It’s nice to be back.   Please send me your feedback at: silentknight@wishingwealthblog.com.

Going on vacation; GMI: +6; Concerns–froth and interest rates; short FRE; Cramer’s mutt–NLY

I started this blog in April and have been posting every market day.  The blog helps me to organize my thoughts and trading, and your many comments empower me.  I am taking a vacation for the next week and a half.  I will post again between August 12-14.  I wish all of you well during this period and hope you will join me when I return.  I will be monitoring my email while I am gone.  So feel free to send me your thoughts and questions.  I will not have my complete charting program with me, however.  By the way, anyone who does not want to purchase TC2005 yet can plot the moving averages I have been discussing by going to the free interactive charts at www.bigcharts.com and choosing the 2 moving average chart option.

The GMI remains strong, but I sense some cracks in individual stocks.  Gmi729 Yes, there were 452 new highs today, but only 74 successful 10 day new highs–60% of the 123 new highs 10 days ago closed higher today than 10 days ago.  This is the lowest number of successful 10 day highs since the QQQQ rally began 16 days ago.  Only 20%-25% of the stocks in the Nasdaq 100, S&P 500 and Dow 30 advanced today.  The QQQQ rally is in day 16 (U-16). 

Remember that the GMI will not catch the top.  It tells us when we can be fairly certain that the trend of the general market has already turned.  So the GMI can be +6 and the market could still be forming a top.  So what bothers me?  First, stocks are jumping up too quickly.  Look at WFMI, ISRG, NDAQ, NTRI.  Good news comes out and stocks immediately gap higher.  After a significant decline, people are cautious and take profits quickly.  Thus few stocks have sustained or large rises.  After a period  of recovery when the prior decline becomes a distant memory, people take bigger chances.  It looks to me like we are in a period when people will make sudden impulsive wagers in order to catch rising stocks.  When stocks start to rise that way I become more cautious. (Watch for a close of the QQQQ below its 10 day average, currently around 39.40.)

The other thing that bothers me is the rising interest rates and oil prices.  We often have a rally during earnings season in an economic recovery as people try to anticipate good reports or buy after good news.  Earnings release time is now almost over and we move into the post-earnings lull when the media and traders will focus on the Fed and the business news.  What particularly concerns me is the rise in longer term rates.  I have been showing you how the short term interest rate indicator has been hitting new highs almost daily.  But now the longer term bonds are beginning to crack.    Tlt729 Look at the Naked Chart (see yesterday’s post for an explanation of this type of chart) of TLT, that tracks the 20+ year treasury bonds.  The rise in the bonds appears to be over as the dotted line (10 day average) crosses below the red line (30 day average).  A falling index means higher interest rates are in store.

Remember I told you a few days ago that I thought FNM and FRE looked sick.  Their charts are mirror images of each other. Look at FRE, which I own puts on.  Fre729 The stock is declining and the 10 day average (dotted line) has now crossed below the 30 day average (red line).   By the way, check out Jim Cramer’s "Best of Breed" in this sector, NLY.  Sure hope you did not follow his recommendation on this mutt!Nly729  Now, what are these mortgage investment stocks telling us about interest rates and the housing market? I suggest to you that it is not good news…………..

So, while I still am mainly long stocks, I have taken short positions in some stocks (FRE, NKE, PNRA) that look particularly weak to me.  While I am away, I will move my sell stops on my longs up just in case we do go into a post earnings release decline.  I hope you all prosper during the coming days in our summer of ’05 as we approach  that fabulous month for bears–October………………………………

Please send me your feedback at: silentknight@wishingwealthblog.com.