GMI: +6; QQQQ weakening; All that glitters: GLD

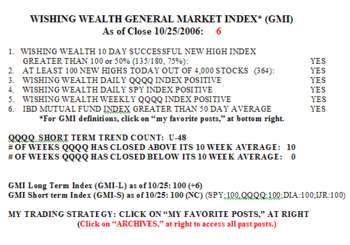
The GMI is still at the maximum level of +6, but I see some serious indications of weakening.  Gmi1216 While there were 148 successful 10 day new highs (stocks that hit a 52 week high 10 days ago and closed higher on Friday than 10 days earlier), they constituted only 47% of the 313 stocks that hit a new high ten days earlier.  There were 173 new highs in my universe of 4,000 stocks on Friday, but only 23% of the Nasdaq 100 stocks advanced.  The S&P 500 stocks (44%) and the Dow 30 stocks (40%) had more advances, but still less than 50%.  Only 46% of stocks are in a short term up-trend, the lowest percentage since November 9.  More bearish was the fact that only 53% of the Nasdaq 100 stocks closed above their 30 day averages, the least since October 28, just before the current rally began.  This time, however, we are coming off of a major advance, and this weakness might signify the beginning of a decline instead of the end. The QQQQ has closed above its 10 week average for seven consecutive weeks and Friday was the 33rd day of the up trend (U-33).  The percentage of stocks closing above their 10 week average is 69%, and suggests that the longer term up trend is still intact. 

The WPM shows the major short term weakness in the QQQQ as well as in the S&P Wpm1216_1small cap stocks (IJR). Only 53% of the Nasdaq 100 component stocks and 54% of the S&P small cap stocks closed above their 30 day averages.  The other indexes appear to be stronger, with the S&P 500 (SPY) stocks doing the best (72%).  The longer term indicators are stronger for the Dow 30 stocks (77% above their 30 week averages) and the S&P 500 stocks (71%)…….

I have moved all of my sell stops to just below their moving averages and have been getting gradually sold out.  Two days of closes of the QQQQ below 41.30 (closed at 41.58) would make me exit this market.  I have successfully avoided market declines since 1995 because I am such a chicken.  The key to successful trading is to conserve capital so as to be able to remain in the game. I can always wade back in when the market strengthens………..

BE CAREFUL OF GOLD! Too many pundits are touting its value.  Look at the weekly chart of the ETF that tracks the price of gold (10x).Gld  There was a high volume reversal this week with a high of 53.73, a low of 49.93 and a close of 50.09, down 2.31 for the week.  The weekly volume was the highest since this ETF began trading at the end of November, 2004.  This may not be the ideal time to test our "mettle" by chasing gold. This most recent rise began in mid-November after a six week consolidation.  Better to buy on the breakout from a new consolidation, rather than after a substantial rise from a base…………

Have you used this site to inform your trading?  Can you send me some experiences I can post for others  (anonymously, with your prior permission)?  Please send your pearls of Wishdom to me at: silentknight@wishingwealthblog.com

GMI: +6; Indicators weaken

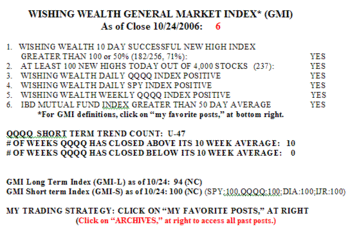
The GMI is still at +6, but there are signs of weakening. Gmi1215 There were only 125 new highs and while there were 152 successful 10 day highs, they represented only 43% of the 353 stocks that hit a new high ten days ago.  Thus, buying stocks hitting new highs ten days ago was profitable in less than one half of the stocks. We are in the 32nd day of this up trend (U-32) , and there are signs of weakening.  Only 44% of the Nasdaq 100 stocks advanced on Thursday, along with 35% of the S&P 500 and 37% of the Dow 30 stocks.  Only 52% of the stocks in my universe of 4,000 are in a short term up trend (down from 65% at the beginning of December), and 70% of stocks closed above their 10 week averages.  Only 12% of the stocks that have doubled in the past year hit a new high on Thursday and only 25% of all stocks are within 5% of hitting a new high.  I continue getting stopped out of my weakening positions, but will buy them back should they strengthen.  We may need a decline to set up an early January rally. My strategy is to keep my sell stops tight and hold off on new purchases for now………………..

How have you used this site to inform your trading?  Can you send me some experiences I can post for others  (anonymously, with your prior permission)?  Please send your pearls of Wishdom to me at: silentknight@wishingwealthblog.com

GMI: +6; Some leaders weaker

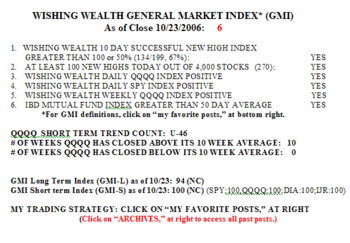
No change in the GMI (+6) but the tech leaders are showing some signs of weakness.  Only 35% of the Nasdaq 100 stocks rose on Wednesday, compared with 65% of the S&P 500 and 63% of the Dow 30 stocks.  Gmi1214 There were 237 new yearly highs in my universe of 4,000 stocks, but only 10% of stocks that have doubled in the past year hit a new high on Wednesday.  Leaders that are downgraded by analysts or hit with bad news are gapping down.  AAPL (-3.9%) is just the most recent example, after CMTL and CUTR recently.  I am slowly being stopped out of my holdings because of my close sell stops.  I will be content to buy stocks back at higher prices when/if they strengthen. Wednesday was the 31st day of this rally (U-31).

NOTE:    A NEW SECTION TO THE BOTTOM RIGHT PROVIDES LINKS TO MY FAVORITE PRIOR POSTS.  THESE INCLUDE MY STRATEGY POSTS, DEFINITIONS OF THE GMI COMPONENTS, AND MY ANALYSIS OF WHY THE TRADING TECHNIQUES OF THE GREAT NICOLAS DARVAS WORK BEST DURING BULL MARKETS AT ALL-TIME HIGHS.

How have you used this site to inform your trading?  Can you send me some experiences I can post for others  (anonymously, with your prior permission)?  Please send your pearls of Wishdom to me at: silentknight@wishingwealthblog.com