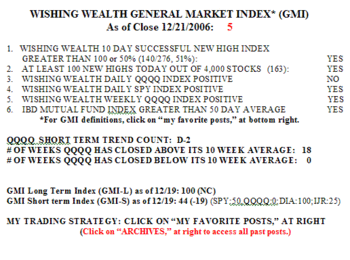
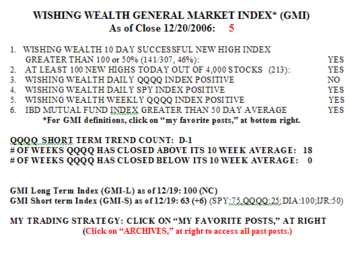
Well, the GMI declined to 1 on Friday and the GMI-S fell to 25. On Friday, only 14% of the Nasdaq 100 stocks rose, along with 21% of the S&P 500 stocks and none of the Dow 30 stocks. 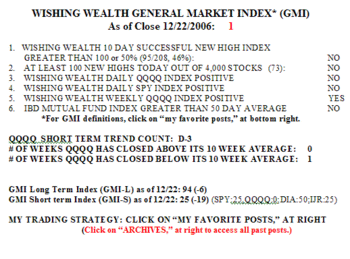 Only 73 stocks in my universe of 4,000 stocks hit a new 52 week high. Only 32% of the Nasdaq 100 stocks closed above their 30 day averages, the lowest percentage since last July. Only 25% of my short term indicators for four indexes are positive; none of the indicators for the Nasdaq 100 stocks are positive, and even the longer term indicators for these indexes has fallen below 100% (GMI-L: 94%) for the first time since October 24.
The IBD 100 stocks are also faltering. Only 38% of the IBD 100 stocks from the list published on 12/18 advanced on Friday and only 2 stocks hit a 52 week high. 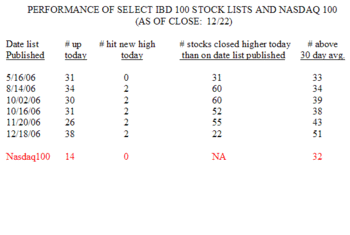 More telling, only 22% of the stocks from 12/18 closed higher on Friday than they did when that list was published. With one exception, less than 50% of the stocks in the IBD 100 lists in this table closed above their average price of the past 30 days, and there were very few new highs.
Beware the general market when the leaders weaken. When a leader like RIMM announces great earnings (+47%) after the close on Thursday , soars on extended trading, and then opens at its high and closes at its low, it is a sign of impending weakness. On Friday, RIMM opened at 139.97, rose to 140.11 and closed at 130.00, down 3.70 on very heavy above average volume. Then look at AAPL which hasn’t hit a new high in 19 days, and GOOG which has not done so in 21 days. All 3 stocks have now also closed below their 10 day averages. With the QQQQ in its 3rd day of a new down-trend, I am slowly accumulating QID, which rises as the QQQQ falls. Since the Nasdaq 100 peaked on 11/24, that index has fallen -3.85% and 66% of the Nasdaq 100 stocks have declined and only 23% have risen 1% or more. With odds like these, it pays to be in cash, or short the tech/growth stock indexes.
