Dr. Wish
Blog Post: Day 34 of $QQQ short term down-trend; $INSW hits another ATH, see daily and weekly charts
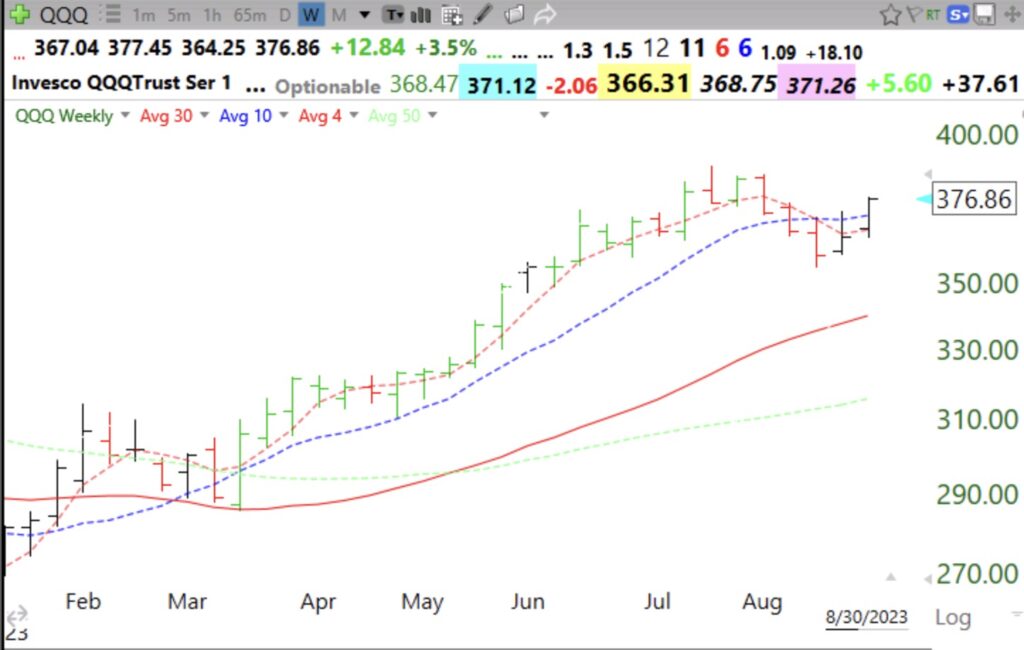
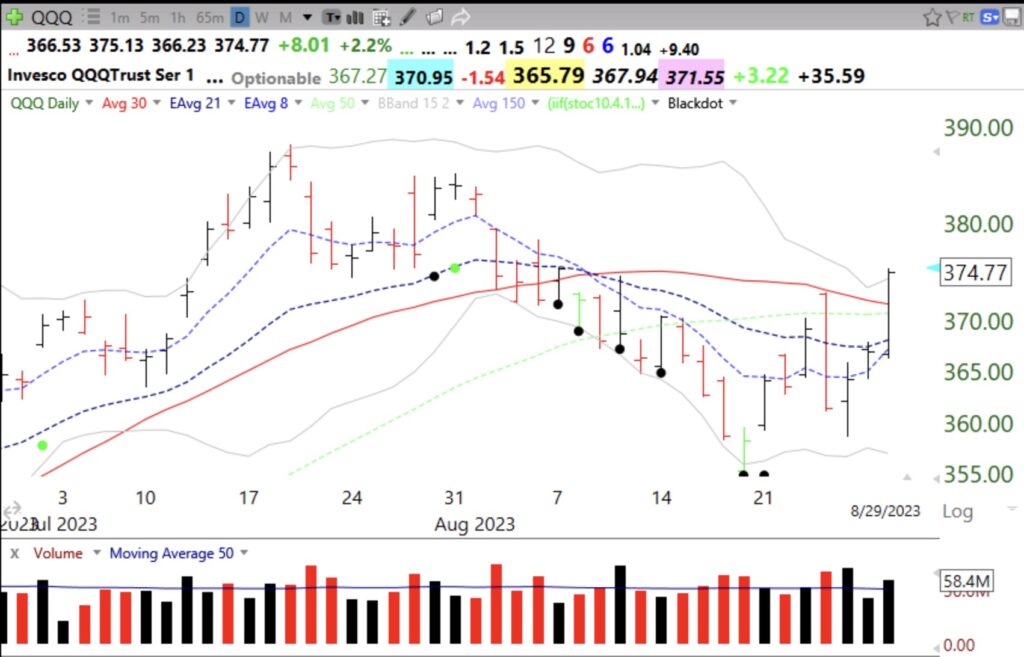
This daily chart shows the 8 ema (dotted line) and 21 ema. Note that the 8 crossed above the 21 last July and has remained above it since. This crossover could be a potential set-up as long as the stock is in a Stage 2 up-trend, which the weekly chart confirms. Note the weekly chart shows 4wk avg>10wk avg> 30 wk avg, a strong Stage 2 pattern. Note the series of weekly green bars indicating a bounce up off of the rising 4 wk avg.
GMI remains RED and registers 1 (of 6).
Blog Post: 70 US new highs and 1008 new lows; Some promising stocks at all-time-highs Thursday: $LPLA, $AMLX, $INSW, $CI, $SGML, see weekly charts.
No one knows whether today’s bounce will hold. However, stocks at ATH could turn out to be leaders. LPLA has held up well the past few weeks. Here is the weekly chart.It has a weekly green bar. I place my stops below the low of the week with a green bar.
As does AMLX and a recent GLB.
And INSW
CI, but no weekly green bar.