The GMI remains at one. Only 24-34% of the stocks in the Nasdaq 100, S&P 500 and Dow 30 indexes advanced on Thursday. There were 54 new highs and 77 new lows in my universe of 4,000 stocks. Only 43% of the stocks in my universe closed above their 10 week averages. 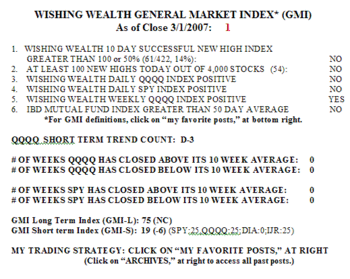 The real reasons behind the markets plunge may be yet to be disclosed. Time to stay in cash.
 Dr. Wish
GMI: 1; Dead cat bounce
The GMI remains at 1. 56-66% of the stocks in the Nasdaq 100, S&P 500 and Dow 30 indexes rose on Wednesday. Only 37 stocks in my universe of 4,000 stocks hit a new high. 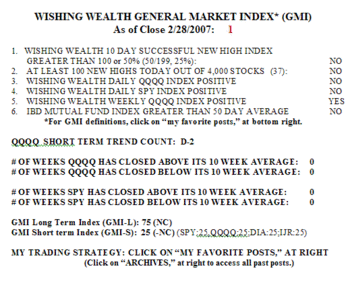 The Dow could only manage a rise of 52 points after falling 400+ the day before. This looked like a feeble dead cat bounce and suggests that there is more weakness to come. Right now it is time to be in cash while we wait for trends to develop.
See my disclaimers at the bottom of yesterday’s post.
GMI: 1; GMI-S: 25; more new lows than highs; play it safe
The only tip off to today’s financial meltdown that I noticed, was the extreme weakness in MER, LEH and BSC, that showed up beginning last Friday when persons in the know apparently started to sell the investment bankers. The GMI is now 1 and the GMI-S is 25. 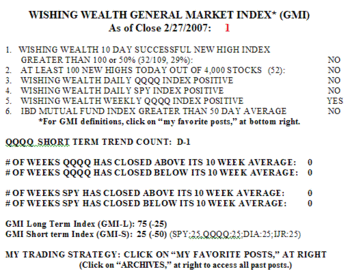 There were 52 new highs and 64 new lows in my universe of 4,000 stocks. Even the IBD growth mutual fund is now negative. When these mutual fund managers cannot make money, neither can I when trading growth stocks. 0-1% of the stocks in the Nasdaq 100, S&P 500 and Dow 30 indexes rose, the worst I have seen since I began blogging 2 years ago. Only 33% of the Nasdaq 100 stocks closed above their 30 day averages on Tuesday. This is no time to be brave, and it would be wise to stay in cash until things settle.
