GMI: +1; Indicators weaken more; some submarines

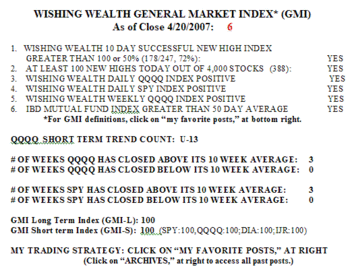
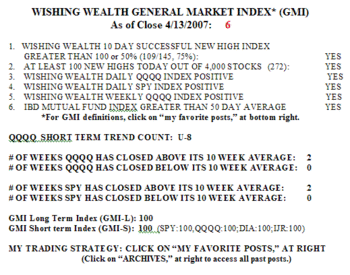
The GMI remains at +1, but just barely.  Gmi0515 There were 121 new yearly lows and 28 new highs in my universe of 4,000 stocks  on Monday.  The last time we had over 100 new lows was the end of October, 2005.  Only 31% of the 274 stocks that hit a new high 10 days ago closed higher on Monday than they did 10 days earlier.  On the other hand, 70% of the 37 stocks that hit a new low 10 days ago closed lower.  This is a clear indication that shorting stocks at new lows has been more likely to have been profitable than buying stocks at new highs. Similarly, there are 114 submarine stocks, compared with just 12 rocket stocks. These are stocks in solid down trends or up trends, respectively.  Only 31% of stocks are in a short term up trend and only 39% in longer term up trends.  11% of stocks are now within 5% of a new low.  Monday was the third day in the new QQQQ down trend (D-3).

I have sold  all of my stocks but one (AAPL).  All of my short positions (put options in my IRA) are profitable.  It has almost been too easy to make money on the short side.  Famous last words????!!!!……………..

People are much too scared of shorting stocks.  But the great traders always go with the trend of the market, up or down.  Buying  put options is a way to go short while limiting possible losses.  In fact, some of my put options expire next January, giving me lots of time for the down trend I have detected to grow.  It is very comfortable to be holding a put on a declining stock that has months to fall. The key is to detect the decline relatively early on.  I simply use TC2005 to scan the entire market for "submarines" that show a clear top about 4-6 months ago and a declining trend on large volume. I detected 114 submarines tonight.  They include:  CMTL, CHS, URBN, SO, GENZ, HOV and CMVT (I am short some of these).  Take a look at the weekly charts of these stocks and note the heavy selling and declining 30 and 10 week moving averages.  It is noteworthy that many of the submarines are utilities and housing stocks, suggesting that we are seeing industry-wide weakness, a good omen for shorting.

Please send your comments to:  silentknight@wishingwealthblog.com.

GMI: +1?; More new lows than highs; Put/call ratio over 1; cash is good

The GMI is almost zero.  The IBD growth mutual fund index is right next to its 50 day average and too close to call.  There were 112 new yearly lows and 32 new highs in my universe of 4,000 stocks.  The leaders, GOOG and AAPL appear to be weakening.  Gmi0512 Only 31% of the Nasdaq 100 stocks closed above their 30 day averages.  It appears that the QQQQ may lead the market down even though it barely participated in the up trend with the DIA.  Both the GMI-L and GMI-S indicators have weakened.  Only 13-15% of the stocks in the QQQQ,  SPY and DIA indexes advanced on Friday.  The only contrary sign I have noticed is that IBD reports that on Friday the put/call ratio was 1.12.  Readings over one usually occur at the end of a decline when the little guy bets on a further decline by buying more put options than call options.  The fact that the index was above one near the beginning of a decline suggests to me that many persons are expecting a market top.  In view of this extreme bearishness I would not be surprised to see a sharp and brief bear rally this week.  Regardless, I am buying long term in-the-money puts on stocks that appear to have topped out. In fact, my TC2005 market scans found more submarine stocks (111) than rockets (19) this weekend.  This in itself is a sign of a weakening market.  Also, 11% of stocks are now within 5% of their yearly lows. Be careful and don’t be afraid to go to cash.

Please send your comments to:  silentknight@wishingwealthblog.com.

GMI: +4; Cramer contrary signal; techs and small caps weaken; raising stops and cash

While driving to work Thursday, I opined that when the Today Show producers are so sure of the bull trend that they invite Cramer to appear and declare that the current bull market is like that of the 1920’s, this was a big indication of a market nearing its top.  Katie missed the opportunity to remind him how the bull market of the 1920’s ended………………

So, the GMI weakened to +4 and the QQQQ closed below its important longer term 30 week average for the first time since last October.  When a major index is below its 30 week average I get very defensive in the stocks represented by that indicator.  But the QQQQ is not alone.  The IJR small cap index short term indicators have weakened greatly (see the GMI-S index below) and this index ETF is now below its 30 day average, a sign of possible short term weakness.  The QQQQ looks miserable and may be on the verge of a major bear market even though it did not participate much in the rise in the DIA and SPY.Gmi0511 Only 10% of the QQQQ stocks advanced on Thursday, along with 11% of the SPY stocks and 3% of the "strong" DIA stocks.  Only 51% of the 4,000 stocks in my universe closed above their 10 week moving averages.  The QQQQ is now in its first day of a new short term down trend (D-1)……….

Given the above, I have raised my sell stops, raised cash and continued buying puts in construction stocks and others that appear to have topped out.  O’neil’s book on how to sell short has helped me a lot to determine the proper stock pattern for shorting.  To short in my IRA, I buy put options.  This in not the time for me  to be brave by holding stocks and hoping for gains…….

Please send your comments to:  silentknight@wishingwealthblog.com.