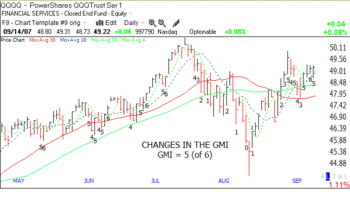
The GMI stayed at 5 on Monday but it was the second day where there were a few more 52 week new lows than highs in my universe of 4,000 stocks. Monday was the 12th day in the current QQQQ short term up-trend.
 Dr. Wish
GMI: 5; IBD100 stocks not good for buy-and-hold
The General Market Index (GMI) fell one, to 5, as there were only 82 new 52 week highs in my universe of 4,000 stocks. Surprisingly, there were more new lows, 90, on Friday, than new highs, usually a troubling sign.  But the QQQQ up-trend remains intact and is now in its eleventh day. (Click on chart to enlarge.) Most important, the 30 day average (red line) appears to be reversing to the up-side. If we get a sell-off in reaction to the Fed next week, I will look for support of the QQQQ at the 30 day average, currently at 47.90. Several closes below the 30 day would decrease the GMI and change my reading of this up-trend. I continue to accumulate the Ultra QQQQ ETF, QLD……
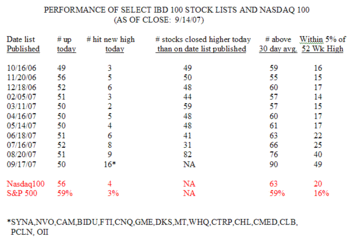
I have written before that I am frustrated with the way the IBD100 Index portrays the performance of the IBD100 stocks. IBD continually drops poor performers from the index, thus biasing the results heavily toward the positive. And a lot of new stocks may be substituted each week. The table below shows how selected IBD100 stock lists over the past year have performed since the day each original list was published. A very important conclusion can be drawn. Only about one half of the stocks in each list closed higher last Friday than they did on the day that list was published. There are two major exceptions. Only 31% of the stocks on the list from 7/16  closed higher on Friday than they closed on that day in mid-July. Why so few? Because the Nasdaq 100 index was at the top of its summer rally in mid-July. In addition, the reason that 82% of the stocks on the list published on 8/20 have advanced since then is that the Nasdaq 100 Index bottomed and started to rally in late August. The moral of the story—even the fate of the IBD100 stocks is largely determined by the trend of the relevant market index, here the Nasdaq100. This is the reason why I always trade consistent with the trend of the market, as measured by the GMI. Another important finding in the table is that the further back one goes, the less likely are the IBD100 stocks to be near their 52 week highs. After about 4 months, the IBD100 stock lists tend to look a lot like the stocks in the Nasdaq100 or S&P500 stock indexes, with 16-20% within 5% of their 52 week highs. It looks like the IBD100 stocks are not good candidates for a long term buy-and-hold strategy. Then again, neither are most stocks…..
GMI back to maximum of 6; Trend is up; IBD100 leaders
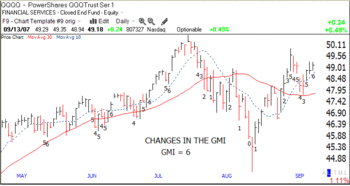
The GMI (General Market Index) is now back to 6 for the first time since July 23.  (Click on chart to enlarge.) Thursday was the 10th day in the current QQQQ up-trend. The Worden T2108 indicator is now back to 52, the highest since July 13 and up from a low of 8 on August 15. This pendulum of the market has swung back to positive and does not typically top out until well above 80. The following stocks on the IBD100 lists some time in the past year hit a new high on Thursday:
BIDU,RIO,VIP,PCLN,CHL,MT,TPX,HANS,CTRP,MTL,BRLI,
FSTR,ICLR,CAM,NVT,DKS,WHQ,OII,LVS,DWSN,SU,HMSY,
FTI,ROS,LAYN,DIOD,RIMM,OIL
This list probably contains many of the market leaders-to-be over the next few months. See my disclaimers below.
