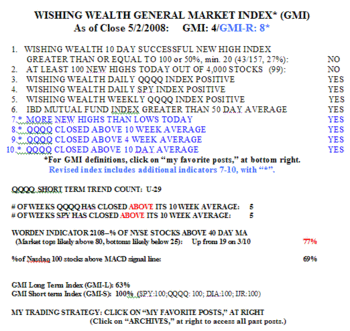
The GMI remains at 4 (of 6) and the GMI-R is at 8 (of 10). (Click on table to enlarge.) There were 99 new highs and 39 new lows in my universe of 4,000 stocks on Friday. April 22 was the last day we had more than 100 new highs. Friday was the 29th day of the current QQQQ short term up-trend.  The Worden T2108 Indicator is at 77%, comfortably in bullish territory. All of my short term indicators for four key stock indexes are positive, GMI-S = 100%. More than two thirds of the Nasdaq 100 stocks have a MACD that is above its signal line. The bottom line is that the Nasdaq market is in an uptrend and that it will last until it ends. So I am riding this up-trend for all I can by being long the ULTRA QQQ ETF, QLD. I also hold positions in AAPL, RIMM, PRGO, V, DZZ. I have written calls on some of these stocks. As long as the QQQQ up-trend holds, the odds favor one who is long growth stocks…
Speaking of growth stocks, long time readers know that I have had a lot of success trading the types of growth stocks that IBD
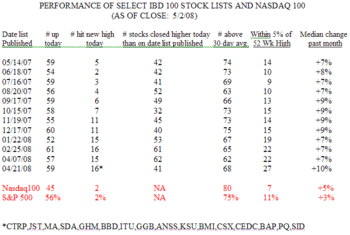
writes about. Every Monday, IBD publishes a list of the top 100 stocks that meet their rigorous fundamental and technical criteria. Market leaders tend to show up on these lists and, contrary to the popular wisdom, it is not too late to buy these stocks once they appear on the IBD100 list. Each new list replaces the weaker stocks on the list with new, stronger stocks. For that reason, their IBD100 Index overestimates the performance of the IBD100 stocks over time. Once each month I therefore create a watch list containing the IBD100 stocks published on that Monday and periodically examine how the various lists have performed. This table shows the results for the lists I have monitored over the past 12 months. A number of interesting findings are evident. Note that only 32-62% of the stocks on each list closed higher on Friday than they closed
on the day that their respective list was published. (Remember that many stocks have shown up repeatedly on each list for a while.) While some of the most recently published lists have performed better, note that in most cases less than one half of the stocks on a list closed higher Friday than on the day they appeared on their respective list. One cannot just buy any of the IBD100 stocks and expect a gain over time. Another finding is that the majority of the stocks from each list rose on Friday. In comparison, 45% of the Nasdaq 100 stocks and 56% of the S&P 500 stocks rose on Friday. However, almost all of the IBD100 lists had more new highs on Friday than the Nasdaq100 and S&P500 Index component stocks. Just 2 of the Nasdaq 100 stocks and 2% of the S&P500 stocks hit a new high Friday, compared with 11-16 of the stocks on the IBD100 lists since November. The outperformance of the recent IBD100 stock lists is also evident in the finding that 19% or more of the stocks on the IBD100 lists since January are within 5% of their 52 week high, compared with only 7% of the Nasdaq 100 stocks and 11% of the S&P500 stocks. The median change (one half did better than the median and one half did worse) in price the past month for the all of the IBD100 stock lists was greater than the 5% median change in the Nasdaq100 stocks and the +3% in the S&P500 stocks. The bottom line for me is that the IBD100 stock list published each Monday is a great place to find possible market leaders that are going to new highs. However, one must not buy them and forget them. Many of the IBD100 stocks will weaken and the trader must remain vigilant. The list published on 4/21 underperfomed recently (only 41% are up) because it contained many of the agricultural, metal and oil stocks that have weakened. The table above (click on to enlarge) lists the 16 stocks on the IBD100 list published on 4/21/2008 that hit a new high on Friday. It is noteworthy that two of these stocks (BAP and KSU) were among the 5 stocks that hit a new high on the list published a year ago, on 5/14/2007 . Since that time, BAP is up 34% and KSU is up 21%. In fact, 28% of the stocks on the list published a year ago are up 25% or more; an amazing 15% are up from 50%-315%. (MTL is up 315%, POT 185%, BIDU 182% and RIMM is up 160%.) Appearing on the IBD100 list was apparently not the kiss of death for these stocks…..