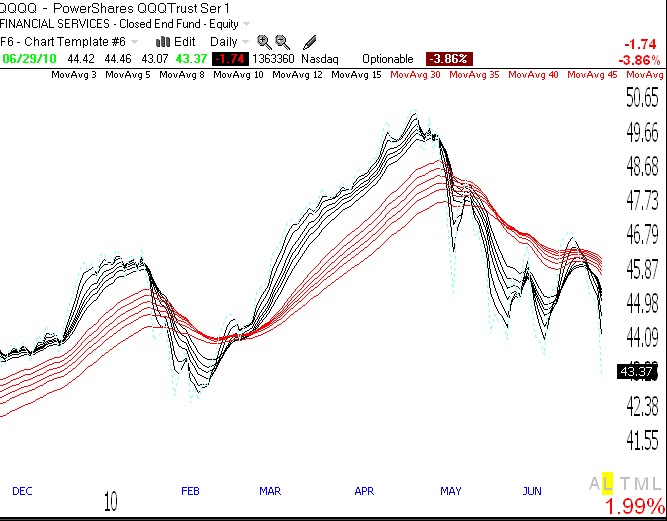
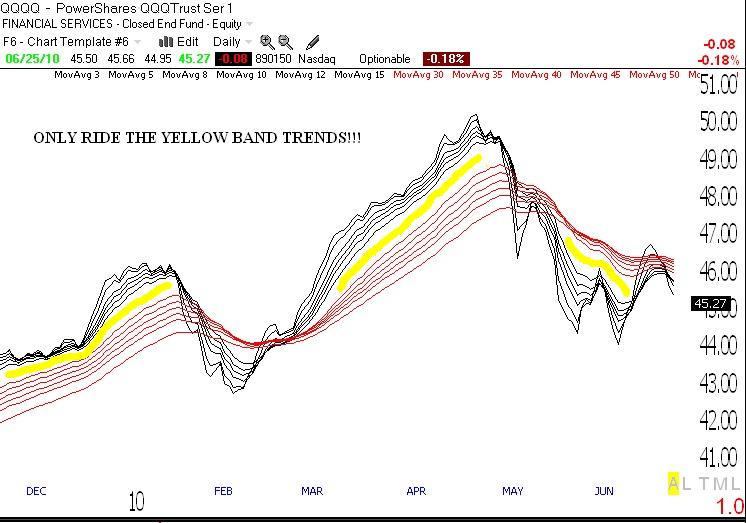
Well, the GMI is back to zero and, by my definition, the QQQQ short term up-trend is now over. One of the toughest lessons I have learned over the past 40 years is that I should only stay in the market when there is a well defined trend. What used to happen to me was that I would ride an up-trend to profits only to give back all of my profits and more, as the market entered a decline. But how to determine when there is a meaningful trend? After studying past winning stocks, I discovered the “yellow band” pattern that works quite well for individual stocks.  I decided to apply my yellow band approach to the Guppy Multiple Moving Average daily chart of the QQQQ. (Click on chart to enlarge.) The yellow band pattern is present when I can draw a yellow band between certain short term and longer term moving averages, that are in turn rising or falling together. Here you can see the yellow band up and down trends that occurred in the QQQQ since late 2009. It is during yellow band trends that I can usually make money trading consistent with the trend. At the present time, the QQQQ is not in a well defined trend, although it may be starting a new yellow band down-trend. All of the short term moving averages (black lines) in the chart are now below the longer term averages (red lines), but they are not separated by much. For me, the odds are presently slim for my trading long or short positions profitably, until a new yellow band trend materializes. Just remember, a change in trend can begin at any time.
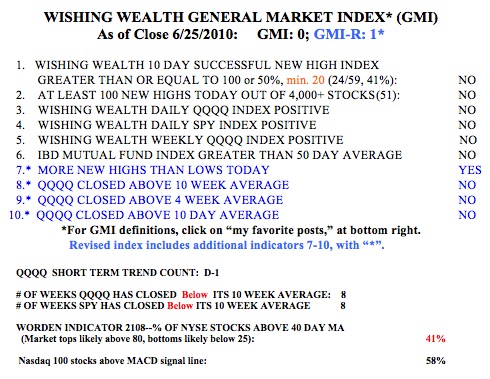
So, the GMI is back to zero, indicating that my original short and longer term market indicators are all negative. The revised, more sensitive GMI-R is at one, because there were more new highs than lows on Friday in my universe of 4,000 stocks. 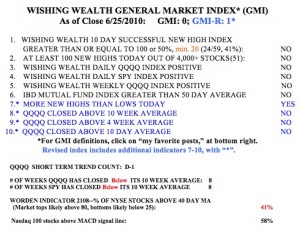 Friday was the first day in the new QQQQ short term down-trend (D-1). The QQQQ and SPY have remained below their 10 week averages for 8 weeks, so even during the brief, 7 day short term up-trend that just ended, the longer term weekly trends were weak. The Worden T2108 Indicator is at 41%, in neutral territory. And 58% of the NASDAQ100 stocks have their MACD above its signal line, down from 95% last Friday.
I wish I could be more positive about the market’s trend. But when my indicators are so weak, it makes no sense for me to try to make money by going long stocks. And yet, the QQQQ short term down-trend is only one day old. When I get a new down-trend I sometimes buy a little QID or TYP (ultra short ETF’s) with the idea of selling it if the trend reverses up, or adding to my position if the market decline deepens. The key to trading success is to have many small losses and a few very large gains.
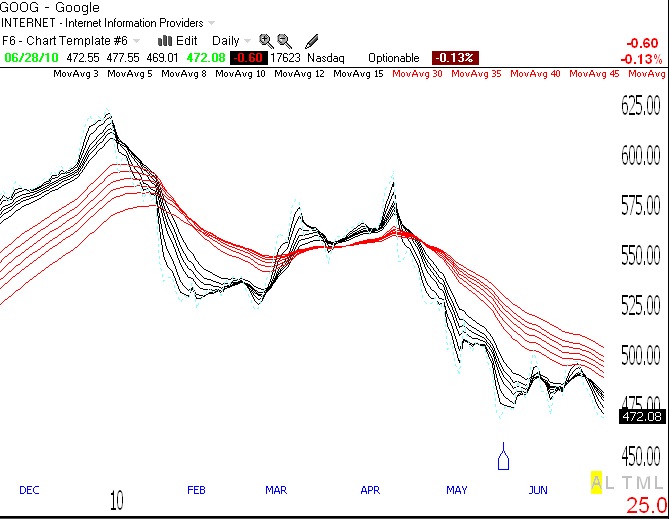
I promised to provide a list of some submarine stocks, stocks that look weak to me by my technical standards. See the last post on submarines I did when I discussed PWRD, which is down more than 30% since then. Submarine stocks tend to decline, sometimes greatly, as long as the market’s tide is going out. Here are 10 of the 95 stocks that showed up, based on my TC2007 scan of the market after Friday’s close: WDC, TECD, VPRT, ALGT, ATNI, UIS, ATHR, BWLD, SLAB, and most interestingly, GOOG. These stocks may be forming Stage 4 declines, a la Weinstein (see his book to the lower right). This is a good watch list for me to research on such things as sector strength, short interest and other technicals. I hold no short positions in any of these stocks.