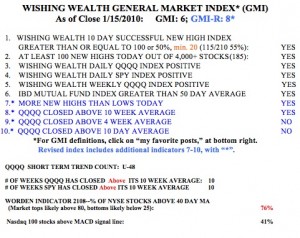
GMI: 0; GMI-R: 0; Worden T2108: 2%; But only 1,296 new lows Tuesday

We may be getting close to a bottom or a bounce.  The Worden T2108 is now at 2%, the only lower reading since 1986 was during the October 1987 crash when it reached 0.5%.  This indicator means that only 2% of NYSE stocks closed above their average closing price over the past 40 days.  However, in spite of the large decline on Tuesday, there were considerably fewer new lows in my universe of 4,000 stocks than the day before, 1,296 vs. 2,119.  So, not as much weakness was exhibited on Tuesday as on Monday.

The best strategy is to stay out of the market or to be short.  Even Jim Cramer is now telling people to get out of stocks if they may need to use their funds in the next five years.  But most advisers are buy and hold, value addicts.  By now we should all see that value is a myth in the market.  A stock is only worth what someone will pay for it.  Don't be scared into this market.  We do not need to be in the market all of the time.  Every meaningful up-trend lasts for months, if not years.  There is plenty of time to get back into the market after a bottom is in and a new up-trend proves itself. When the GMI rises to 3 or more it will be time for me to tiptoe back into this market.  And remember that the market, which always looks forward,  will turn while the economic news is still bad.

Thank you again to all who have sent me messages about how they have used the information from this blog to protect their investments.

GMI: 0; GMI-R: 0; T2108: 4%; 2,119 new lows; indicators at extreme lows

My indicators are at some of the lowest levels possible.  Only the 1987 decline reached a lower level on the Worden T2108 indicator than the 4% reached on Monday.  In the three years of my blog, I have never found that anything near 2,000 stocks in my universe of 4,000 stocks hit a new 52 week low.  There were 21 new highs and 2119 new lows on Monday.  Only 3% of the Nasdaq 100 stocks closed above their 30 day averages. Monday may have been the low for this bear market, but we must wait to see if it holds.  Bear market bottoms are usually retested several times, so we must wait until the market reveals if we have reached a true bottom.  Meanwhile, Monday was the 25th day of the current QQQQ short term down-trend. (This short term down-trend occurs within a longer term down-trend.)

Thank you to the many readers who sent comments about how this blog has helped them to avoid losses during this decline.  I am inspired by your commitment to managing your funds during these tough times.

GMI: 0; GMI-R: 0; Current financial mess predicted in NYT in 1999; T2108 at extreme low: 6%; My GMI indicators kept me out of this decline–how about you?

On September 30,  1999, the New York Times printed an article about pressure from the Clinton Administration on Fannie Mae to ease their credit requirements on loans to increase home ownership rates among low income consumers.  The article contained this eerily accurate warning from Peter Wallison:

''From

the perspective of many people, including me, this is another thrift

industry growing up around us,'' said Peter Wallison a resident fellow

at the American Enterprise Institute. ''If they fail, the government

will have to step up and bail them out the way it stepped up and bailed

out the thrift industry.''  Check out the original article at: http://query.nytimes.com/gst/fullpage.html?res=9C0DE7DB153EF933A0575AC0A96F958260&scp=1&sq=&st=nyt or click on his name above.

Could the current mess be the result of good intentions gone wrong? (Thanks to a colleague for alerting me to this article.)

With the Worden T2108 indicator (percentage of NYSE stocks closing above their 40 day average) at an extreme low, the market remains treacherous but may be near a bottom or bounce.  Going back to 1986, market declines reached lower readings only twice; October 1987 at 0.5% and August, 1990 at 5.3%.  All other bottoms occurred at 7% or above.  So Friday's reading of 6% is about as low as it gets, except for the October 1987 decline of the Dow, falling 22.6% in one day.  In comparison to the 1987 debacle, the current decline has been slow and measured.  The 777 point decline last Monday was only 6.98%.  In comparison, on October 28, 1929 the Dow fell 13.5% and on the following day, another 11.7%.  Since the peak of the Dow a year ago, in October, 2007,  the Dow is down a total of about 26%.  So, in the  context of the greatest market declines, the current decline has been relatively slow and small –at least thus far.  I said small, not painless.

The gamblers among us might try to guess the bottom, or at least the bounce.  With the GMI and GMI-R at zero, I prefer to wait on the sideline in cash until the new up-trend has begun. 

On June 8, I wrote:  "Last week I transferred all of my

pension money from mutual funds into money market funds.  When I looked

at how most of the Dow 30 stocks are  doing, I became very concerned of

the future of that index and the general market."  I started this blog three years ago because I was so upset by the way the media pundits encouraged people to buy and hold stocks all through the 2000-2002 decline.  I have successfully avoided all of the major market declines since 1995 and wanted to provide my audience with the tools I use to protect themselves in subsequent declines.  I make no profit or commercial value from this blog.  Again, the media pundits have tried to keep people in stocks all through this decline.  I hope that some of my readers avoided the present decline by exiting the market last June when I did.  My 401-K plan has escaped the current decline and has been in a money market fund since early June. Please let me know if any of you have had similar success.