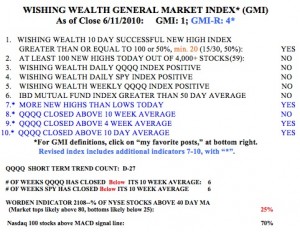
The GMI has moved up to 1 (of 6), because the 10 Day Successful New High Index turned positive, and the GMI-R is at 4 (of 10), reflecting the strength in my very short term trend indicators.  The Worden T2108 is now out of bottom territory, at 25%. The number of NASDAQ 100 stocks with their MACD above its signal line is now up to 70%, indicating short term strength. Still, Friday was the 27th day of the current short term down-trend in the QQQQ (D-27), and the QQQQ and SPY have closed below their key 10 week averages for six weeks. I cannot trade profitably on the long side when the key indexes are below their 10 week averages.
There is a very interesting article in Barron’s online about the strong likelihood we are entering a bear market. When a big publication like Barron’s has the courage to publish such a bearish article, it sometimes serves as a good contrary indicator. So it makes me stop and question whether I should get on the bear bandwagon. Right now it is important to respect the current down-trend and to try not to anticipate a change in trend. When a real change occurs, I will have plenty of time to jump on board. I am therefore content to wait for my indicators to detect any turn. I remain mainly in cash, holding some GLD and a few shorts.