QQQQ rally continues, in 14th day and up 8.7%, but 3X emerging bull ETF, EDC, up 28.2%

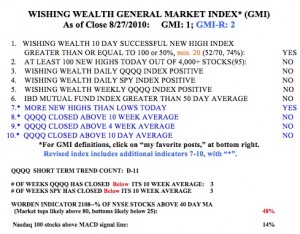
GMI4/6
GMI-R8/10
T210884%

There were 11 new highs and 4 new lows in my universe of 4,000 stocks on Monday.   Five of the 11 new highs were on the IBD100 list from March 30:   TNDN, NFLX, GMCR, NTES and CPSI.   All of these but CPSI hit all-time highs, an extraordinary accomplishment, given the market’s decline over the past year.   Any stock trading today at an all-time high is probably worthy of   attention.   I own GMCR and NFLX.   One other stock on the new high list Monday is TSYS, which I wrote about months ago.   It has huge recent earnings increases and has been in a steady up-trend.

I am putting more and more funds back into the market as this up-trend continues. By my indicators, the QQQQ   just completed the 14th day of its short term up-trend.   During that time, the QQQQ has advanced 8.7%, while the ultra long QQQQ ETF, QLD,   has advanced 17.6%.   During QQQQ up-trends I buy QLD.   During this same time period, the emerging markets bull 3X ETF, EDC, has advanced 28.2%.   Those who say the 3X ETF’s are worthless as trading vehicles (as in J. Cramer) should look at these data.

Dow “bottom rally” puny thus far!; IBD100 and other growth stocks at new highs; I’m bullish for now

GMI4/6
GMI-R7/10
T210884%

A lot of stocks are beginning to look good.   However, there were only 6 new highs and 8 new lows in my universe of 4,000 stocks on Friday.   Two of the 6 new highs are stocks on the IBD100 list,   CPSI and TNDM.   TNDM is at an all-time high and both of these stocks came public within the past 8 years, a prime criterion of past winning stocks, according to IBD founder William O’Neil.       I scanned my universe and found 105 stocks that are within 10% of their 52 week highs and that have promising technicals.   Among these stocks that   are on my IBD100 lists from the past year and that also have last quarterly earnings up 50% or more are:   AIPC, GMCR, ALGT, QSII, SXL, JJSF, NFLX and PNRA.   I own some of these stocks…

The GMI remains at 4 and the GMI-R is at 7.   The IBD Mutual Fund Index is above its 50 day average, indicating to me that growth mutual funds are starting to make money. When these fund managers can make money buying growth stocks, so can I. The Worden T 2108 is now at 84%, heading towards overbought territory, but not a concern to me, given that the market is snapping back from very over-sold readings.   Both the QQQQ and SPY have closed above their 10 week averages for several weeks, a key sign of technical strength. While still in longer term down-trends, when these ETF’s are above their 10 week averages, I have usually been able to make money buying stocks.  

Read more

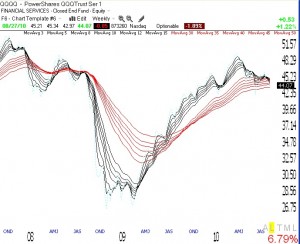
Tech rally looks real; Daily Guppy chart looks good

GMI4/6
GMI-R8/10
T210883%

My indicators keep getting stronger.   The GMI is 4 for the first time since August 20, 2008.   There were more new highs than lows (22 vs. 6) in my universe of 4,000 stocks on Thursday.   The Worden T2108 indicator is at 83%, the highest reading since 89% on January 6.   This is typically an over-bought reading, but in July, 2003 when the market began the new bull market after the preceding bear market, the T2108 reached 93% as the new bull market got going.   Thus, the current high reading may represent the burst of buying after a long bear market.   Finally, the daily Guppy chart of the QQQQ suggests the beginning of a new up-trend.  

Read more