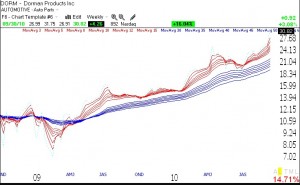
The QQQQ short term up-trend completed its 18th day on Thursday. During that time, the QQQQ has risen 7.4% , QLD (the ultra 2x bullish QQQQ ETF) by 15.6%, and the TYH (3x bullish technology ETF) by 22.7%. This analysis shows once again that one can do quite well by riding the up-trend with one of the 2X or 3X ultra index ETF’s. Below is another RWB rocket stock to begin to research. During tough economic times people tend to fix their cars rather than trading them in, thus producing profits for auto parts businesses like DORM.
 Dr. Wish
End of quarter; T2108 high
With the end of the quarter today, I am watching carefully to see if we will get a short period of October swoon before earnings start coming out. While my indicators are all positive, note the T2108 is 84%, a high reading typical of an overbought market.
Air pockets in 2 leaders on Tuesday; RWB rocket: HWK
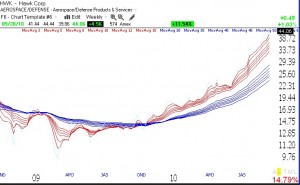
AAPL and BIDU had large volume intraday declines but closed well off their lows. Such “air pockets” could be a sign of weakness to come. However, their daily and weekly up-trends remain intact for now. Tuesday was the 16th day of the current QQQQ short term up-trend. During this up-trend the QQQQ has gone up 8%, while the QQQQ ultra long ETF (QLD) has risen 17%. In the same time period, HWK has risen 18%. HWK is an RWB stock I have been following for quite a while. It has been on my cumulative IBD100 list since August. I do not own it. (Click on weekly chart to enlarge.) RWB rocket patterns were explained in my Monday post.

