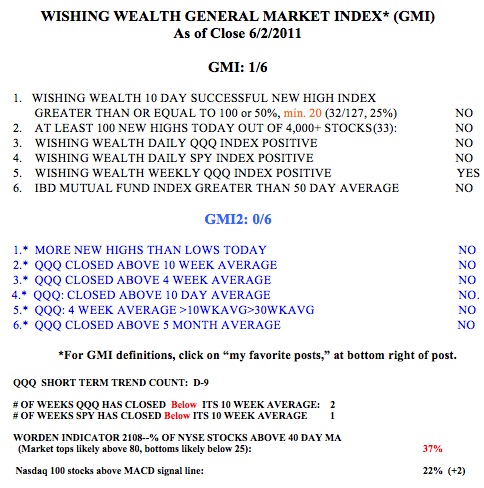
The indexes are very close to breaking above their key longer term moving averages. There were 134 new 52 week highs and only 17 new lows in my universe of 4,000 stocks on Thursday. The Worden T2108 Indicator is now at 70%, almost in overbought territory. The GMI is at 4. The IBD Mutual Fund Index is now above its 50 day average, which is still declining. The key is not to jump the gun but to wait for a definite signal of a longer term up-trend. The GMMA daily chart of the QQQQ (click on chart to enlarge) shows that the short term averages (black) are climbing up through the longer term averages (red)–but they are not there yet!
Dr. Wish
GMI back to 2; On the sidelines, in cash
The GMI declined to 2 (of 6) and the GMI-R to 4 (of 10). We are at a point in time when the daily moving averages are flat and the major indexes whipsaw us as they close above and below the averages. I am concerned when the leaders like AAPL, GOOG and NFLX are weak and unable to reach new highs. The leaders of the prior bull move often weaken and decline before the rest of the market. On the other hand, the Investors Intelligence polls show about as many newsletters are bearish as bullish, a rare occurrence and a contrary, bullish sign.
It is much easier to be in the market when there is a clear general market trend. This is a good time to be on the sidelines safely in cash.
GMI rises to 3, critical test coming; Judy buying APKT and ARMH
For the first time since June 21, there were more than 100 (104) new 52 week highs in my universe of 4,000 stocks. In addition, 73% of the stocks that hit a new high 10 days ago closed higher on Tuesday than they did 10 days before, showing strength in stocks hitting new highs. While the GMI rose to 3 (of 6) all 4 of the more sensitive indicators in the GMI-R are now positive, yielding a GMI-R of 7 (of 10). The Worden T2108 Indicator is at 60%, indicative of a rising, but not overbought, market. And the QQQQ closed slightly above its 10 week average, breaking a run of 11 weeks below that critical level. What is the major negative? The 10 and 30 week averages are still in down-trends, reflecting a potentially serious down-trend.
Given these conflicting signals, it is time for me to move my stops very close on my short positions and to remain mostly in cash. It remains to be seen if the indexes can hold on to these critical short term technical levels through the close on Wednesday. If they can, I will slowly wade back into the market on the long side. It is critical not to marry a particular market scenario and to be ready to adjust quickly to a significant change in trend.
By the way, my very wise stock picker friend, Judy, took small long positions in APKT and ARMH on Tuesday. Judy buys stocks based on the concept behind the business and her own technical analysis methods and frequently buys a stock before my technical indicators signal a buy.