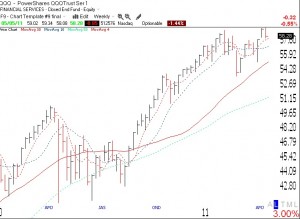
12th day of QQQQ short term down-trend; 23% chance it could last 30+ days

GMI1/6
GMI-R2/10
T210839%

The GMI remains at 1 (of 6) and the GMI-R at 2 (of 10).   The T2108 is back to 39%, still in neutral territory.   Time to be in cash and or short. I reviewed the statistics on the past 24 short term down-trends for the QQQQ.   I found that once a down-trend lasted at least 11 days, there was a 54% chance it would last 21 days or more, and a 23% chance it would last more than 30 days. The longest short term down-trend during this period lasted 69 days.

QQQQ trend remains flat; mainly in cash; beware September

GMI1/6
GMI-R2/10
T210848%

The QQQQ bounced on Friday from very oversold daily stochastic readings.   The daily stochastic remains oversold, so Friday’s bounce may last a little longer.   However this weekly GMMA chart of the QQQQ   (click on to enlarge) shows all of the moving averages converging and flat.   We are just going to have to wait for the market to break out one way or the other.

Meanwhile the GMI is one (of 6) and the more sensitive GMI-R is 2 (of 10).   The Worden T2108 is at 48%, in neutral territory.   Only 14% of the Nasdaq 100 stocks closed Friday with their MACD above its signal line, an indication of general short term weakness. Friday was the 11th day (D-11) of the current QQQQ short term down-trend. And the QQQQ and SPY have closed below their 10 week averages for three straight weeks.

So, I remain largely in cash but holding a few shorts and a few long positions protected by put options. I know I shouldn’t own any stocks right now but there are a few stocks I cannot resist buying given that they have held up so well through the current market weakness.   I list   some of the stocks I am trading to the right in the “Stocks I’m Watching” section. Remember, September tends to be the weakest month of the year for the stock market.