QQQQ Short term down-trend still intact–15th day; KMR: cup-with-handle break-out?

GMI3/6
GMI-R7/10
T210866%

Thursday was the 15th day of the current QQQQ short term down-trend.   It will take a few more days of a rise to turn the QQQQ trend into an up-trend.   Meanwhile, my short term indicators in the GMI-R have turned up, to +7.   The GMI remains at +3.   I generally like the GMI to be 4 or more to feel comfortable going long.   A lot of stocks have bounced and it remains to be seen whether the market   is setting up for a major up-trend.

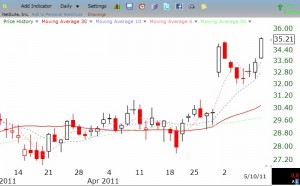
With a possible up-trend on the horizon, it is time to look for stocks breaking out of bases.   Stocks that break to new highs early in a market up-trend often become leaders in a real rally. KMR hit an all-time high on Thursday.   Imagine a stock emerging from this weak market at an all-time high! KMR is also up 30% from a year ago.   It looks like a cup-with-handle break-out, as this weekly chart shows (click on chart to enlarge).   The volume on Wednesday was above its 50 day average, a good sign for a break-out. William O’Neil made the cup-with-handle chart   formation famous.   Note that KMR has also   found support at its critical 30 week average (red line), and is in a StanWeinstein Stage 2 up-trend. If one purchases a stock breaking from a valid base, O’Neil’s research shows one should place a stop about 8% below the break-out price of 60.50.   Valid break-outs, he says,   rarely decline to 8% below the break-out point. That would mean a GTC (good-til-canceled) stop order to sell should be placed at about $55.50.   My preference would be to place a stop order at 58.59, just below the 5 day low and   the 10 week average (dotted blue line).   KMR’s last quarterly earnings were up about 192%. Time will tell if   KMR is a winner.

Among the stocks on my IBD100 and New America lists that hit an all-time high on Thursday are:   CVLT, SXCI, APKT, CMG, TDG, EW, RHT, CRM, FOSL, INFA, OPEN, MFB, DLTR, BAP, CTXS, CLW, AAP, PCLN, MWIV, AZO, IT, LZ, MCD, CIB, NEOG, and SAN.   Some of these will prove to be true winners and I own a few.

Was Wednesday a new IBD follow-through day?

GMI3/6
GMI-R5/10
T210857%

With all of the pundits calling for a September drop and a double dip recession, the market fooled them all–at least for one day. And the Investor’s Intelligence poll shows that investor adviser sentiment is quite bearish with almost as many bears as bulls.     This poll has been a contrary indicator, with market tops occurring when there are many more bulls (near 60%) and bottoms when there are many bears. Rarely are there more bears than bulls. IBD called Wednesday’s action a follow-through day on the rally that began last Friday. Even though the indexes I follow are still in short and long term down-trends, the GMI advanced to 3 (of 6) and the more sensitive GMI-R, to 5 (of 10).   One reason is that the IBD mutual fund index just crossed above its 50 day average, indicating that growth mutual funds are rising. This has been a bipolar market.   On Tuesday we had 151 new 52 week lows in my universe of 4,000 stocks, only to have 174 new highs on Wednesday. I have found such action is typical at turning points, until the new trend gets going. It   is a tug-of-war between bears and bulls.   In a few days we will know if this is indeed   the start of a real tradable up-trend.   Right now, it is best for me to hedge/close my short positions and to look for stocks to buy.   A lot of the stocks that I have been watching had resisted the down-trend and did well on Wednesday. Check out the stocks to the right that I have been watching. Every stock I buy is protected by a put option or a stop loss order.

GMI back to zero

GMI0/6
GMI-R0/10
T210839%

Technical difficulties prevented me from posting.   In the face of a down-trend there are some stocks I have been following that are showing continued strength.   Check out the stocks in my list to the right.   Let’s see how long today’s bounce will last.