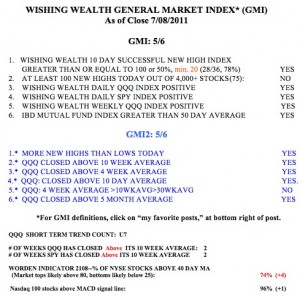
It looks like the debt raising crisis is over. So, with my market indicators largely positive, I am going to tiptoe back into this market.
 Dr. Wish
QQQ short term up-trend still intact
But at least my university pension is largely in cash right now. I can sleep a little better.
QQQ short term up-trend reaches 7th day; weekly Guppy chart shows resumption of up-trend; AAPL strong
I am impressed by the action of the leaders on Friday, especially of AAPL (which I have bought call options on). Five of my nine leaders rose on Friday.  Growth stocks are back in vogue. The GMI and GMI2 are both at 5, of 6 and both the QQQ and SPY are above their 10 week averages. I therefore must not fight this up-trend. Options expire on Friday and then we are into 2nd quarter earnings releases.
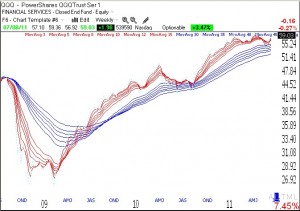
A reader asked me to post the GMMA chart for the QQQ. The weekly chart below (click on chart to enlarge) shows that the market has held support and the shorter term averages (red lines) have turned up.
Nevertheless, I am still worried about whether the debt limit talks will be resolved on time. I remain largely in cash in my university pension until the situation is resolved. And yes, I realize I let the news and my emotions take priority over the market’s action. But sometimes it pays to be on the sidelines so I can sleep at night.
My more speculative money is in the market in some call options in tech stocks. When AAPL rises during a steep market decline like Friday’s, it indicates to me a lot of underlying technical strength. And I love my new iPad! I can easily access TC2000 on it and run scans and my favorite charts. I buy AAPL cautiously, however, knowing that any bad news about Steve Job’s health would likely send the stock on a sharp decline.
