Markets rebound–again; QQQQ weekly chart reveals market trend; TDSC rockets higher

GMI4/6
GMI-R8/10
T210874%

The GMI and GMI-R are both indicating a general market up-trend. The Worden T2108 is back to 74%, still in neutral territory.   Meanwhile this weekly chart of the Nasdaq 100 index shows it to be in a firm up-trend since September.   The key bullish pattern of 4wk>10wk>30 wk average is evident and the index has continually found support at its 10 week average (blue dotted line).   I have to relearn the lesson over and over again, to focus on weekly trends, so as not to be shaken out of the market by daily fluctuations. Note also the Stage 2 up-trend, with the index well above the rising 30 week average (red line). A key sell signal for me will be a close below the 10 week average, currently at 56.83. For those of you new to charting and technical analysis, you can use the free chart program at freestockcharts.com.   Just add the moving averages, 4,10,30 as indicators and select the week as your time period on the chart. (Click on chart to enlarge.)

Last December, I wrote about a Judy’s pick, TDSC, at around $31.   Yesterday TDSC rose 10% to $53.29,   an all-time high. My stock-buddy, Judy, researches “concept” stocks, and finds more future winners than any other person I have ever met.

Indexes are hugging support; on to options expiration

GMI4/6
GMI-R6/10
T210863%

The markets are going back and forth around the key support levels I monitor.   With options expiration coming on Friday, I think the best course for me is to take very small positions until the short term trend becomes evident. With most first quarter earnings announcements already out there is less major news to move individual stocks.   It is the expectation of better earnings that pushes stocks higher, but second quarter earnings will not begin to be released until April. We are in the relatively calm period between earnings releases. However, as we all know, major world events can also influence the short term course of the markets.   I remain in a gold ETF and a little short the QQQQ. The longer term   trends of the indexes I follow (SPY, DIA, QQQQ) remain up.

GMI back to 4; Raising cash and adding SQQQ and DGP

GMI4/6
GMI-R6/10
T210861%

The market averages are very volatile and have come back down to critical support again.   The new QQQQ short term up-trend is in jeopardy.   I am raising cash in my trading account and am slowly wading into the ultra bearish QQQQ ETF, SQQQ.   SQQQ is designed to go up 3x as much as the QQQQ (Nasdaq 100) declines.   I enter the inverse ETF’s when the market indexes weaken.   If a true down-trend develops, I will add to my position in SQQQ.   SQQQ rose 4.7% on Tuesday, as the QQQQ declined -1.6%.   By buying the inverse ETF’s, one’s account can grow as the market declines. It is very important to be cautious as I wait for the market to reveal its short term trend.   The longer term trend remains up, for now.

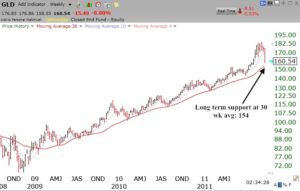
I also own the ultra long gold ETF, DGP.   DGP strives to rise 2X as much as gold does.   DGP rose +3.4% on Tuesday as GLD rose +1.7%. Note that DGP (and GLD) is in a picture perfect Weinstein Stage 2 advance and has found support at the 30 week average (red line) repeatedly during the past 2 years. Click on weekly chart to enlarge.