When the 30 week average curves down, it means the current week’s close just added is less then its close 31 weeks earlier that has just been dropped from the average. Think of it, IWM is now lower than it was 31 weeks ago! For me this pattern is the kiss of death that got me to exit stocks before the major declines in 2000 and 2008. Last week, IWM rebounded to kiss its 4 wk average (red dotted line). Let’s see if it can close back above it this week. That would be a sign of strength. If not, there is an inverse ETF for IWM, TWM, but I must be nimble. if I should nibble.

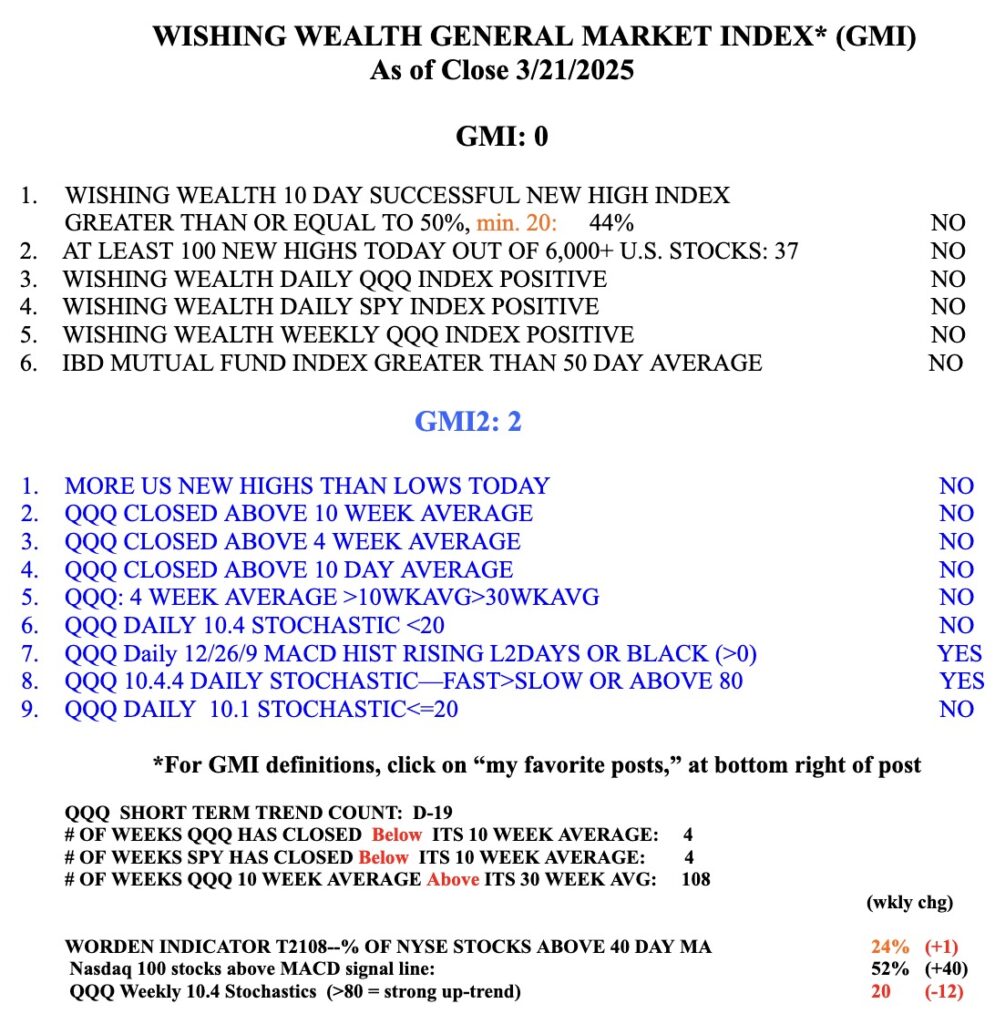
What a weak market! When the Worden indicator, T2108, now 24%, falls below 10%, I might nibble at a little SPY, but not individual stocks, some of which may not come back..
Screenshot