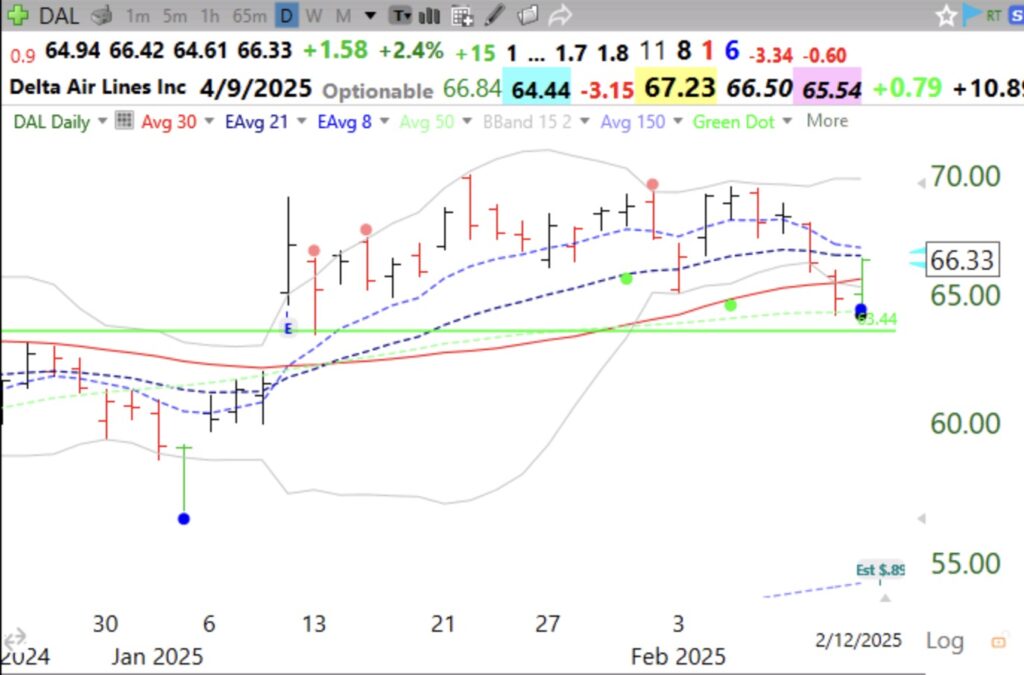
I love this setup. Find a stock that had a recent GLB to an ATH and then declined to oversold (the blue and black dots on the chart designate oversold levels) and has bounced up. Today’s setup would enable me to place a close stop just under yesterday’s low. If my stop is triggered, I take my small loss. But I then watch it to see if it bounces again. Some of my best gains come from a stock I have researched and like but have been shaken out of and then buy it back!!!! Every loss brings me to the next gain. Study this setup. I will explain it in detail on May 21 when I present at the Boston IBD Meetup.

Here is its weekly chart. Note it is bouncing up off of its 10 week average, another promising sign. And the 4wk>10wk>30wk, a necessary requirement. IBD Comp=90. Note also that Sept-Nov of last year it rode the 4 wk average up for over 10 weeks–the invaluable sign of a strongly advancing stock. Another place to buy is the bounce up off of the 4wk avg.

Is your minervini presentation available anywhere? Will the Boston IBD meetup recording be public? Thank you!
Was there a GLB on Feb 3 on $HOOD?