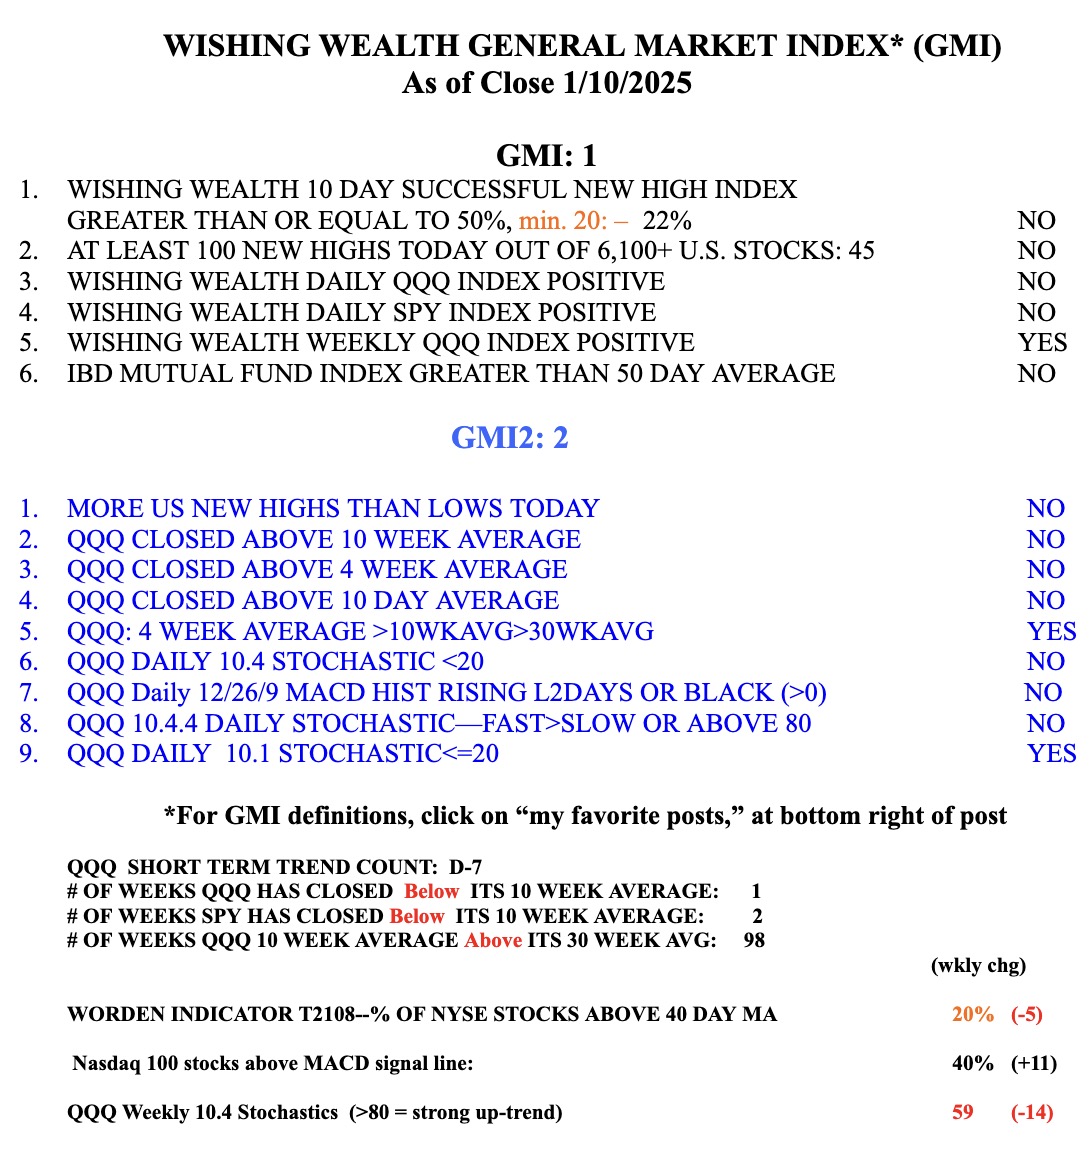
With bonds in a steep decline, the market will have competition from higher interest rates. This chart shows a daily RWB down-trend. With the GMI=1, I am mainly in cash in my trading accounts. There were only 45 US new highs and 218 lows on Friday. This is not a market for me to buy stocks at highs. But earnings season may cause a short term bounce up with so many indicators oversold. I won’t trust a rise until my indicators strengthen. Too many people I meet have gains from the past two years and remain eternally bullish–until the next large decline scares them out, at the bottom. If T2108, now 20%, should go below 10% I may become interested in nibbling on an S&P500 index ETF, not in individual stocks, many of which might not recover.

A good and concise market analysis, thanks for all that you do!
Hey Professor Wish,
My name is Dustin, and I am a former student of yours.
I sold all my accounts and assumed major profits… I am holding entirely “cash” in these accounts.
I would like to know if this will be taxed?… 20% of my market liquidation came from my Roth IRA and the rest was holdings across various platforms.
Thank you
Hi Dr. Wish
I have followed your blog since around 2011. Thanks for the many insights and tools, especially your visits to Northern Virginia Community College.
Terence R.