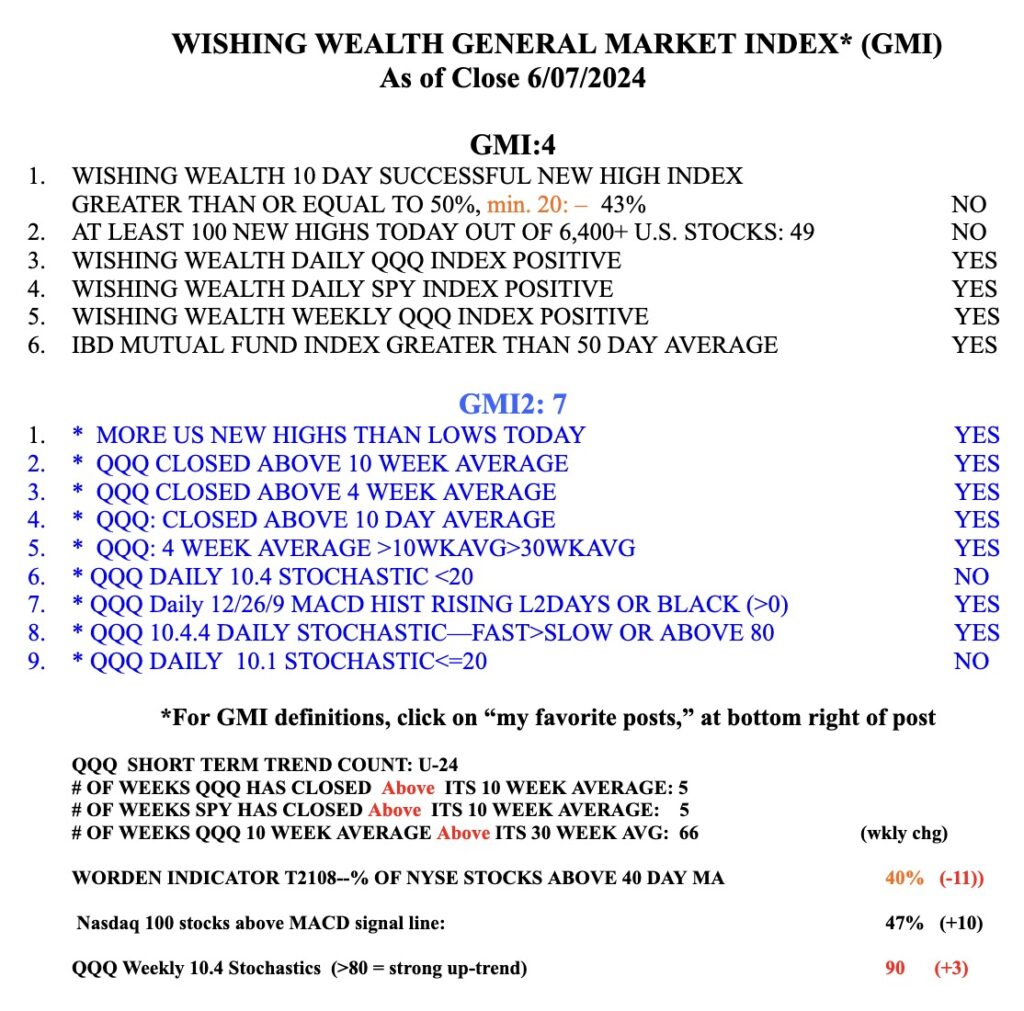
While the other 4 components of the GMI remain positive, I am concerned that the 10 Day Successful New High and Number of New High components are negative. For someone who likes to trade stocks at new highs it is worrisome to me that prior new highs are not doing well and there are fewer stocks hitting new highs. The market averages may be masking this weakness. I am therefore very cautious and mostly in cash now. However, if I had been disciplined enough to buy TQQQ on 5/6, Day 1 of the new QQQ short term up-trend, I would be sitting on a gain of +30.1%, greater than 98% of the Nasdaq 100 stocks (only NVDA and MRNA did better) and 99% of the S&P500 stocks. I hope some of you had the courage to follow this TQQQ strategy based on my QQQ short term trend indicator. Let me know……


In June 9 you showed day 1 (green arrow) but I am unclear what was the signal. I see possibly 2 signals. Is the green arrow an indicator you programmed?
Jeff
Hello. I really appreciate your work and blog but I think you got the maths wrong on this one. Between 6 May and 7 June, TQQQ went from $58.56 to $67.12, which is slightly under 15%. Not bad, but not 30%
Exactly right.
My own strategy triggered a buy signal on 5/7 and it’s up 13% until 6/7
https://www.alphasignals.net/tag/strategy-update/
Exactly right.
My own strategy triggered a buy signal on 5/7 and it’s up 13% until 6/7
https://www.alphasignals.net/tag/strategy-update/
To follow your TQQQ strategy, I need the strategy to sell TQQQ. If not is very dangerous.
I would have tried your TQQQ strategy, but you only posted well into the short term uptrend…is there some way to get timely updates on the change to GMI and the short term trend indicator?
Dr Wish, where I could find your TQQQ strategy details? tnx!