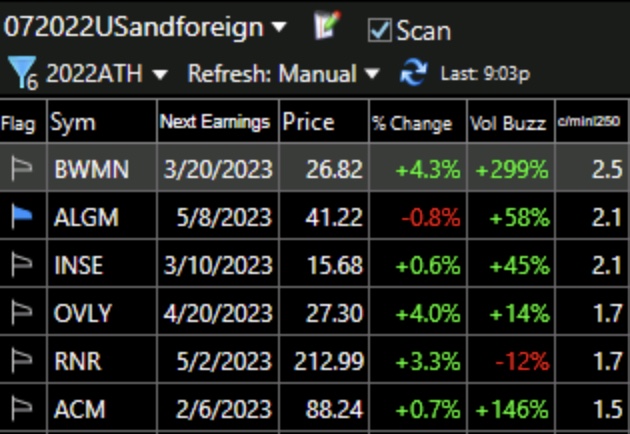
Those of you who have followed my blog or workshops (available at the tab on this blog) or have taken my course may remember the yellow band concept. These are advancing stocks that have closed each week above their 10 week averages for at least 10 consecutive weeks or more. The 10 week average is rising above the 30 week average so that one could draw a yellow band in the white space between them. These 5 stocks are yellow band stocks and reached an ATH on Monday. Only one, ALGM, is flagged, indicating its presence on my watchlist of stocks recently on a MS or IBD list. Three of them are already twice their low of the past year, see last column.
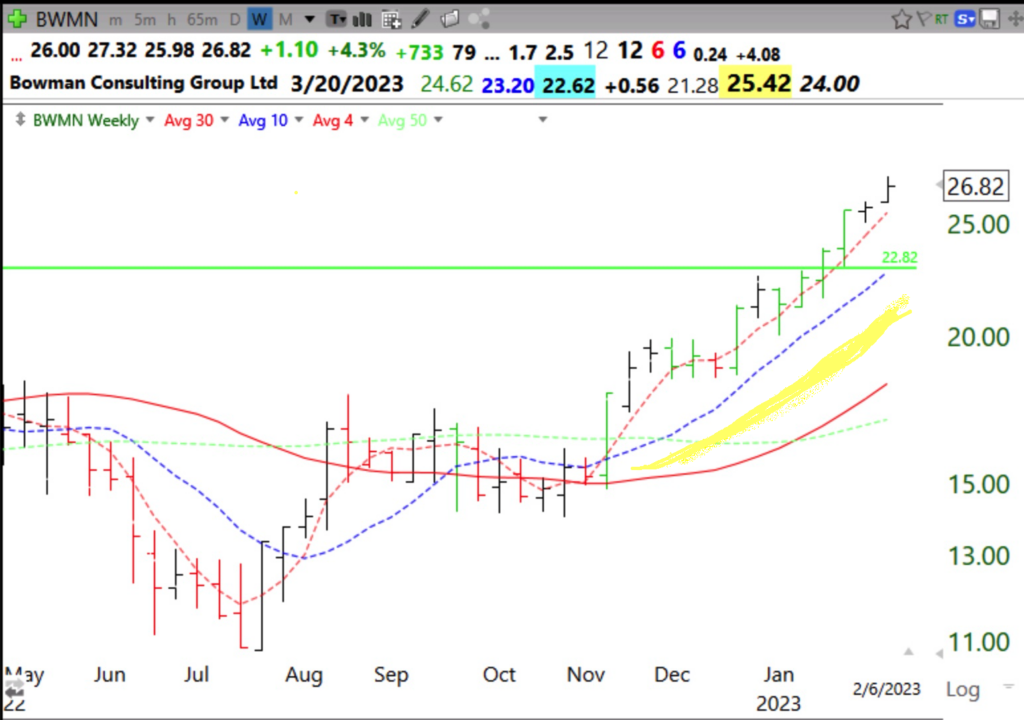
This weekly chart of BWMN illustrates the yellow band pattern. Note the recent GLB (green line break-out) and the many weekly green bars. In fact, BWMN has closed each week above its rising 4 week average (red dotted line) for 8 straight weeks, another sign of technical strength. I first wrote about BWMN after its GLB.

