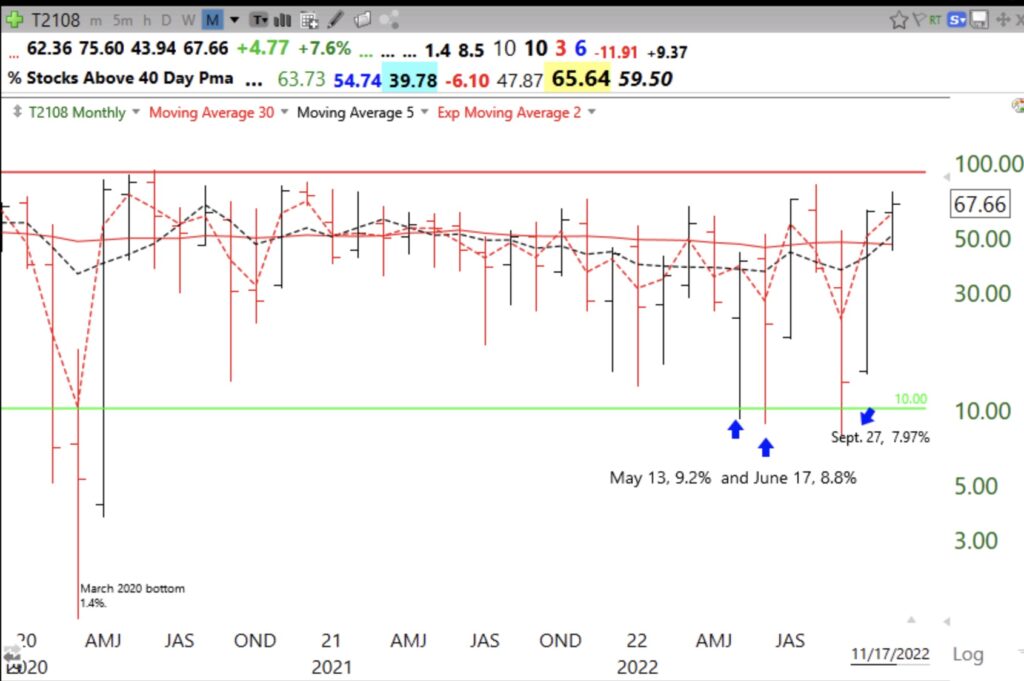
When T2108 declines to <10%, it often signals the bottom of the decline. See monthly chart.
Share this:
- Click to email a link to a friend (Opens in new window) Email
- Click to share on Facebook (Opens in new window) Facebook
- Click to share on X (Opens in new window) X
- Click to share on LinkedIn (Opens in new window) LinkedIn
- Click to print (Opens in new window) Print
- More
- Click to share on Pocket (Opens in new window) Pocket
- Click to share on Pinterest (Opens in new window) Pinterest
- Click to share on Tumblr (Opens in new window) Tumblr
- Click to share on Reddit (Opens in new window) Reddit
- Click to share on Telegram (Opens in new window) Telegram
- Click to share on WhatsApp (Opens in new window) WhatsApp

Thank you Eric and congrats on calling the top last year (I haven’t been following since then but I heard about it). Did your portfolio flip to long recently, because I see your previous post mentions a leveraged long position. All the best
I sometimes buy a little TQQQ on day 1 of new QQQ short term up-trend. I buy more if it reaches day 5.