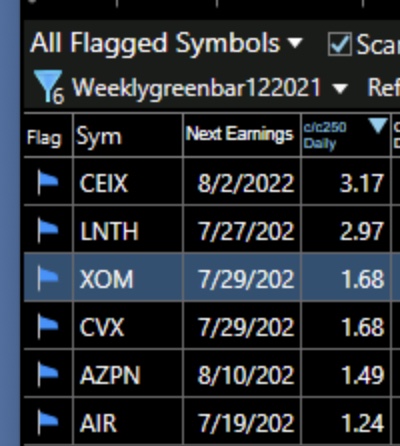
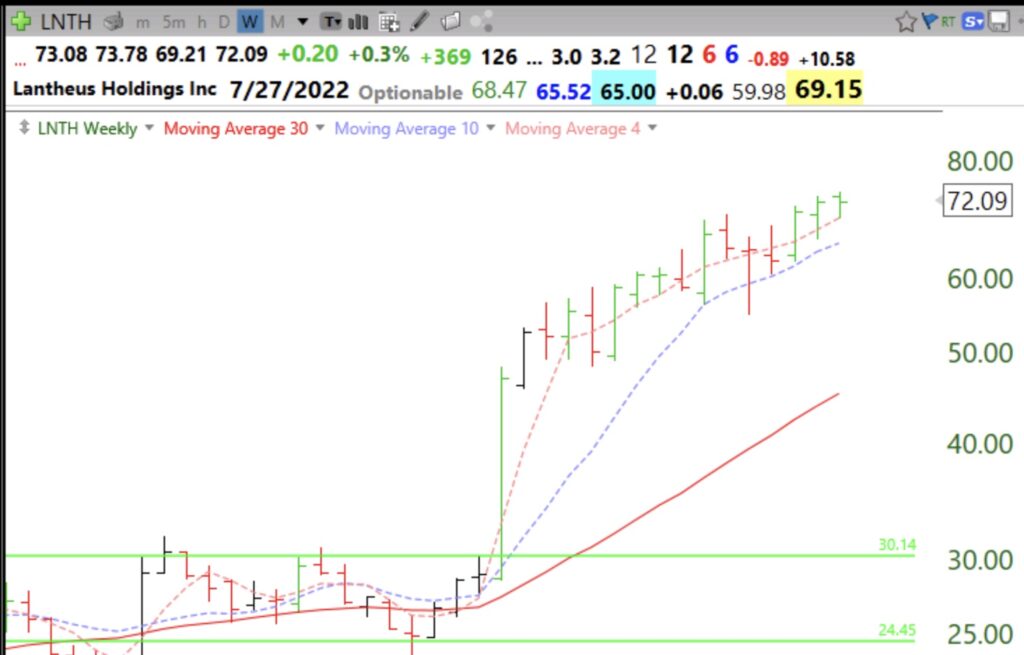
My weekly green bar scan finds stocks that have recently reached an ATH, have 4wk>10wk>30wk averages and 4 wk avg is rising and stock bounced up off of the 4 wk avg this week and closed up today. Their relative strength vs SPY also must be at a 20 week high. And they must be >$30. I ran this scan on my watchlist of stocks recently listed on IBD50 or MS growth250 lists. I found only 6 stocks out of 782 passed the screen. They are ranked by close today/close 250 days ago. Thus, CEIX and LNTH have tripled over the past year.
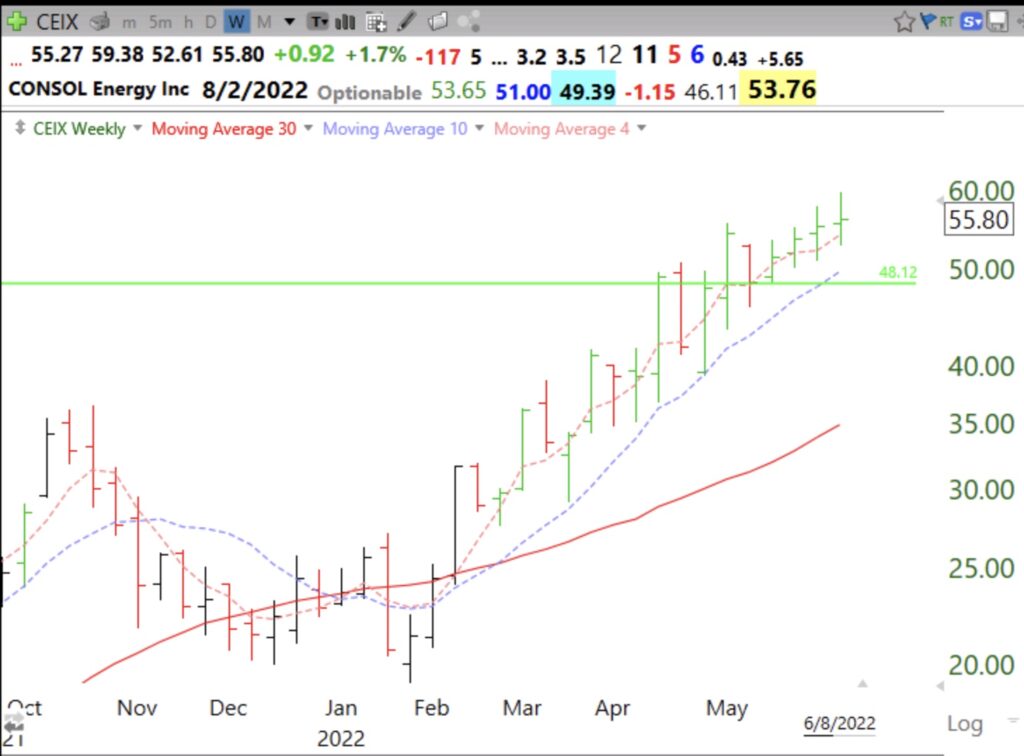
Here is a weekly chart of CEIX. Note that this week’s price bar is green and check out the 4,10,30 week averages. A rising stock will repeatedly close the week above its 4 week average. If I buy a green bar stock I place my stop below the low of the green bar and may move it below each successive green bar. Note CEIX had a GLB 5 weeks ago and the 10 week average (red dotted) is climbing nicely above the 30 week average (solid red). This is my favorite yellow band rocket stock pattern. A close below the 10 week average would also cause me to exit.


