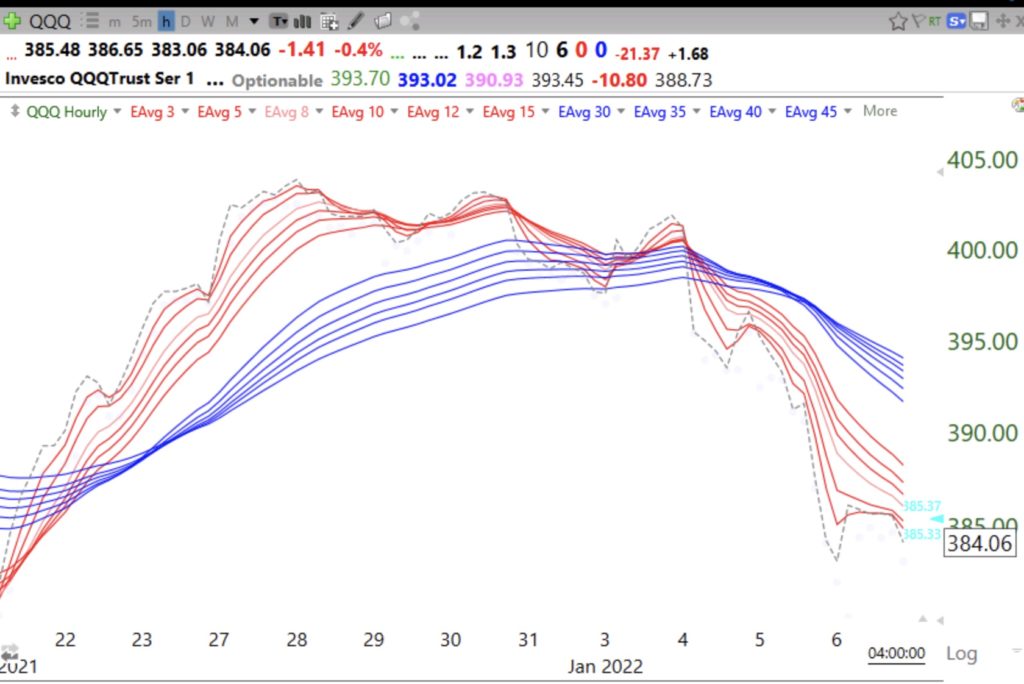
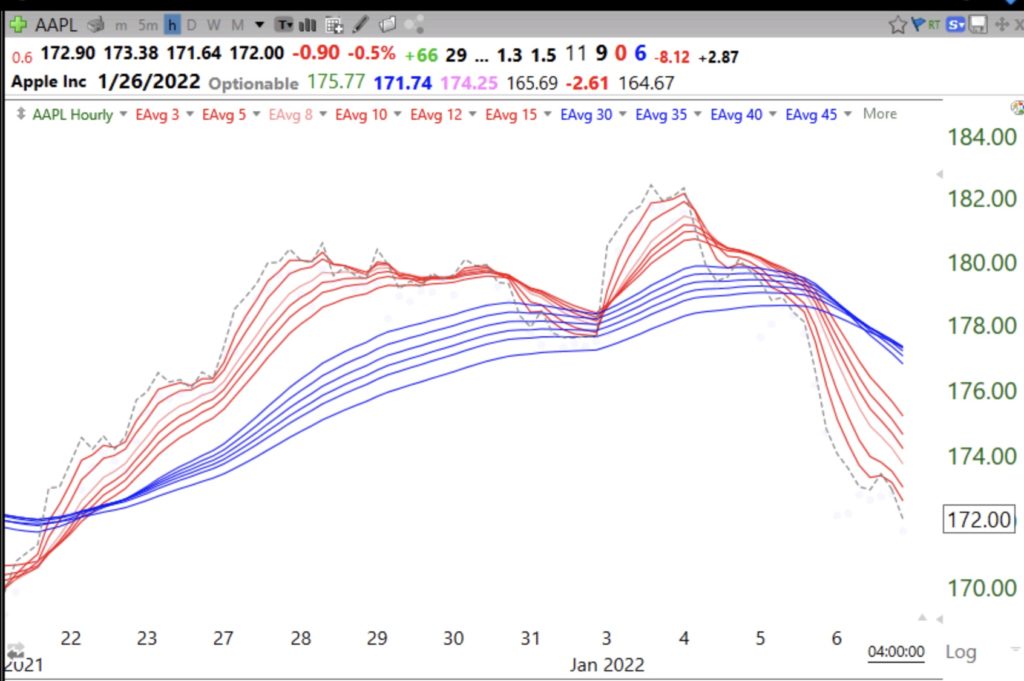
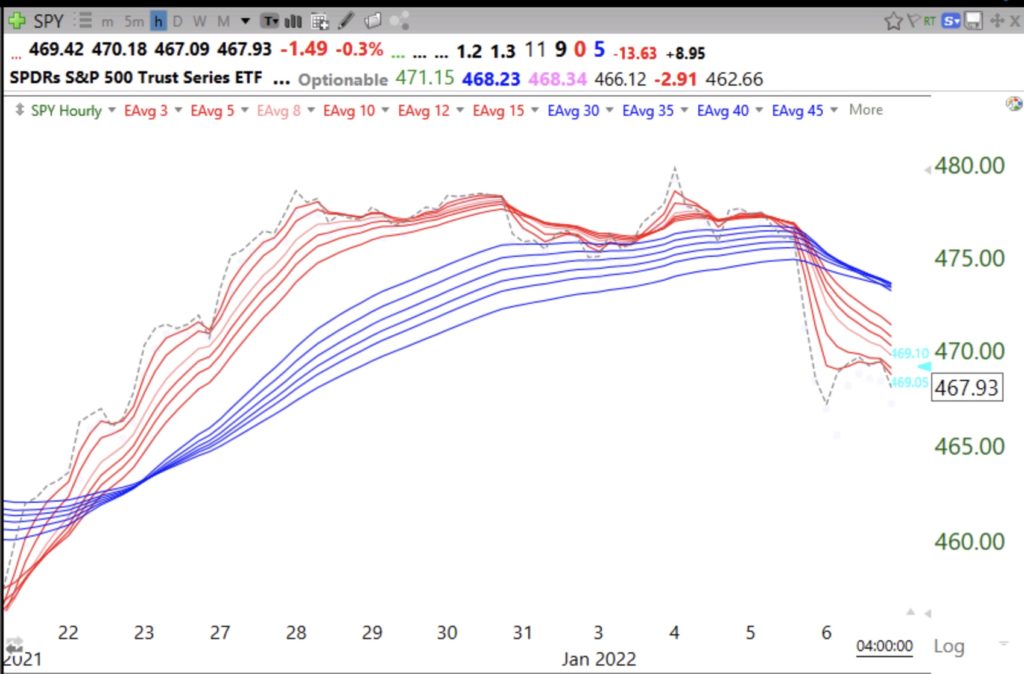
I usually look at the adapted GMMA daily and weekly charts to see the trend of the market or individual equities. However, for timing entries and exits, the hourly GMMA may prove useful. Check out the clear hourly blue-white-red (BWR) down-trends in QQQ
and AAPL and SPY.
My former student, Richard Moglen, has a tutorial for creating GMMA charts in TC2000.


