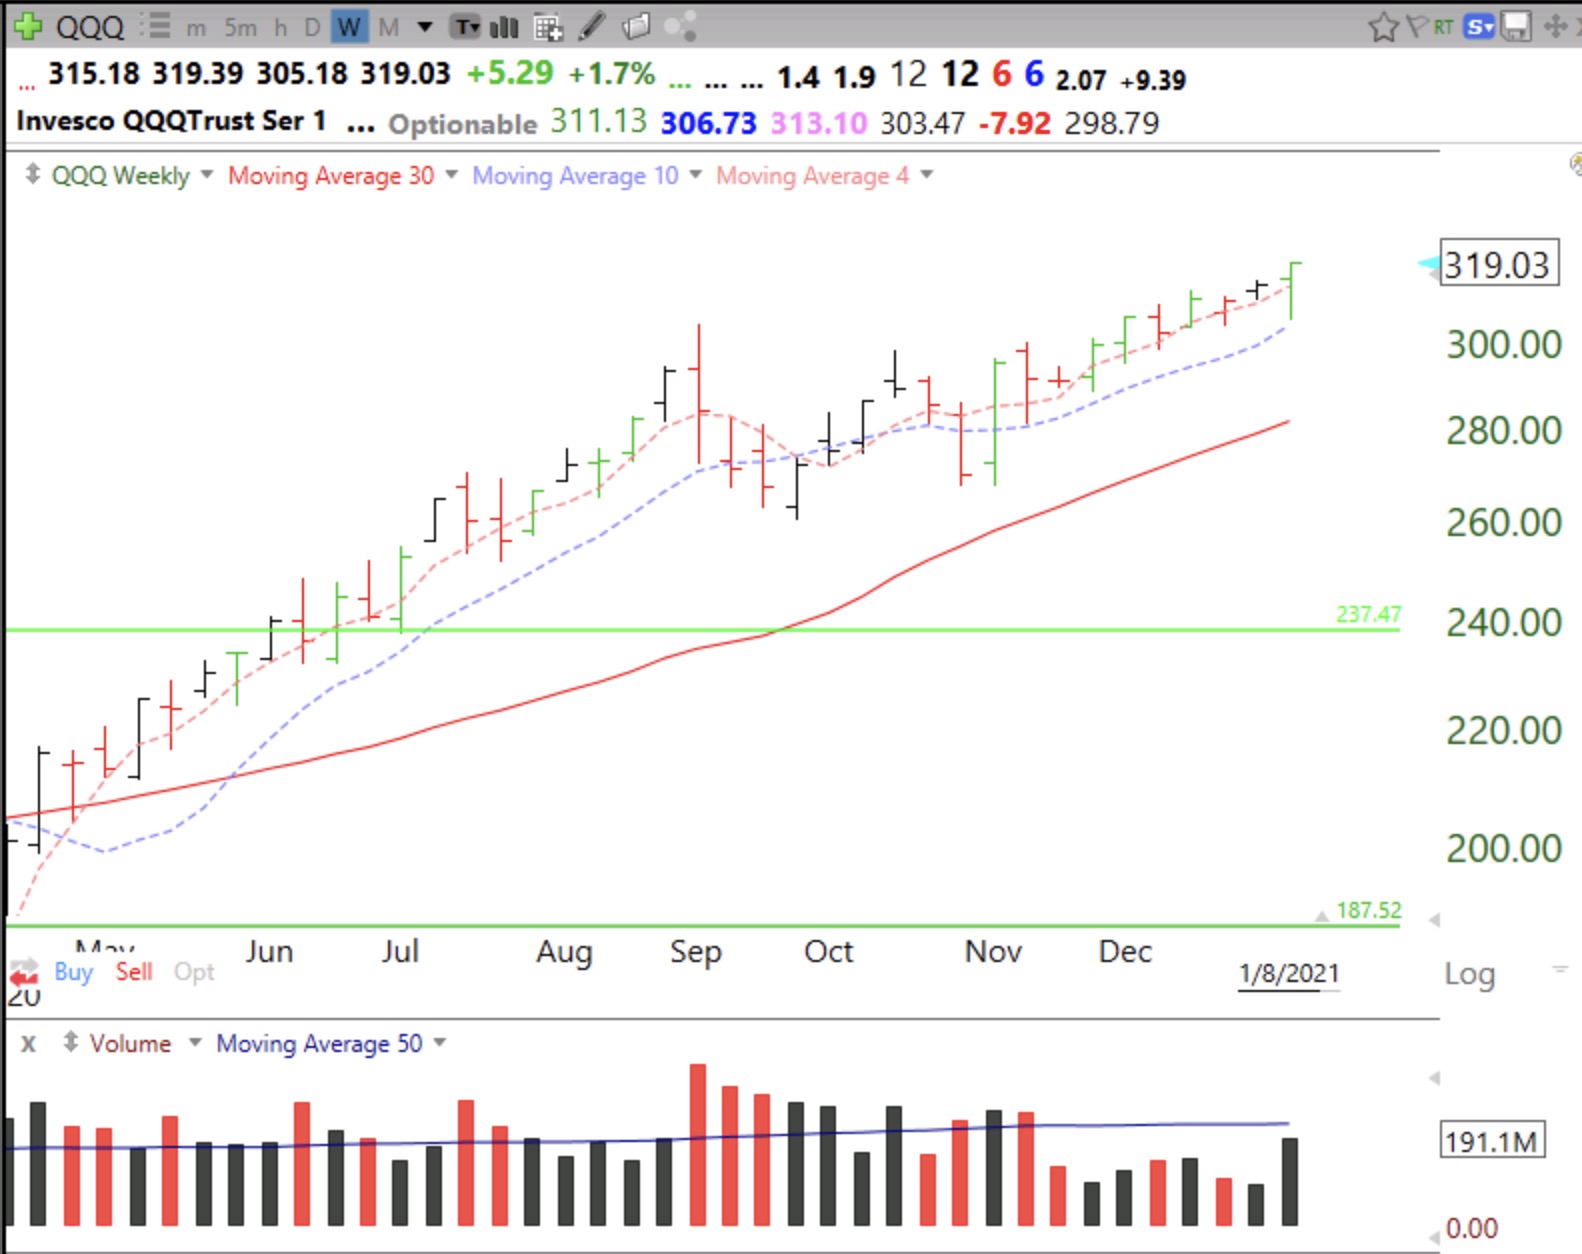
The market had 488 new yearly highs among US stocks on Friday and more than 500 on Wednesday and Thursday. The last time we had more than 500 new highs in a day was January 16, 2018! Two weeks later the market had a 12% decline. I am a chicken and very defensive most of the time–I am too close to relying on my retirement funds to live on. When many millennials and my students are reporting large gains in their trading I get even more cautious and defensive. And 60%of investment newsletter writers are bullish, an ominous sign. For now, all of my indicators are positive and the DIA, SPY and QQQ all had WGBs last week. So the indexes are not extended above their 4 week averages. But so few of these youthful traders have ever experienced a bear market decline which lasts for 10 or more months and grinds everything down. Is this time different? I do not think so. No stock , even TSLA, climbs forever. I remain heavily invested in mutual funds in my university pension. In my trading IRA I am largely in and out of cash. Below is the weekly chart of QQQ, showing its recent WGB (weekly green bar). A close below its 4 week average (red dotted line) will signal possible short term weakness. A close below the 30 week average (solid red line) will signal severe weakness and maybe a change in trend. The QQQ has closed the week above its 4 and 10 week averages for 10 straight weeks!
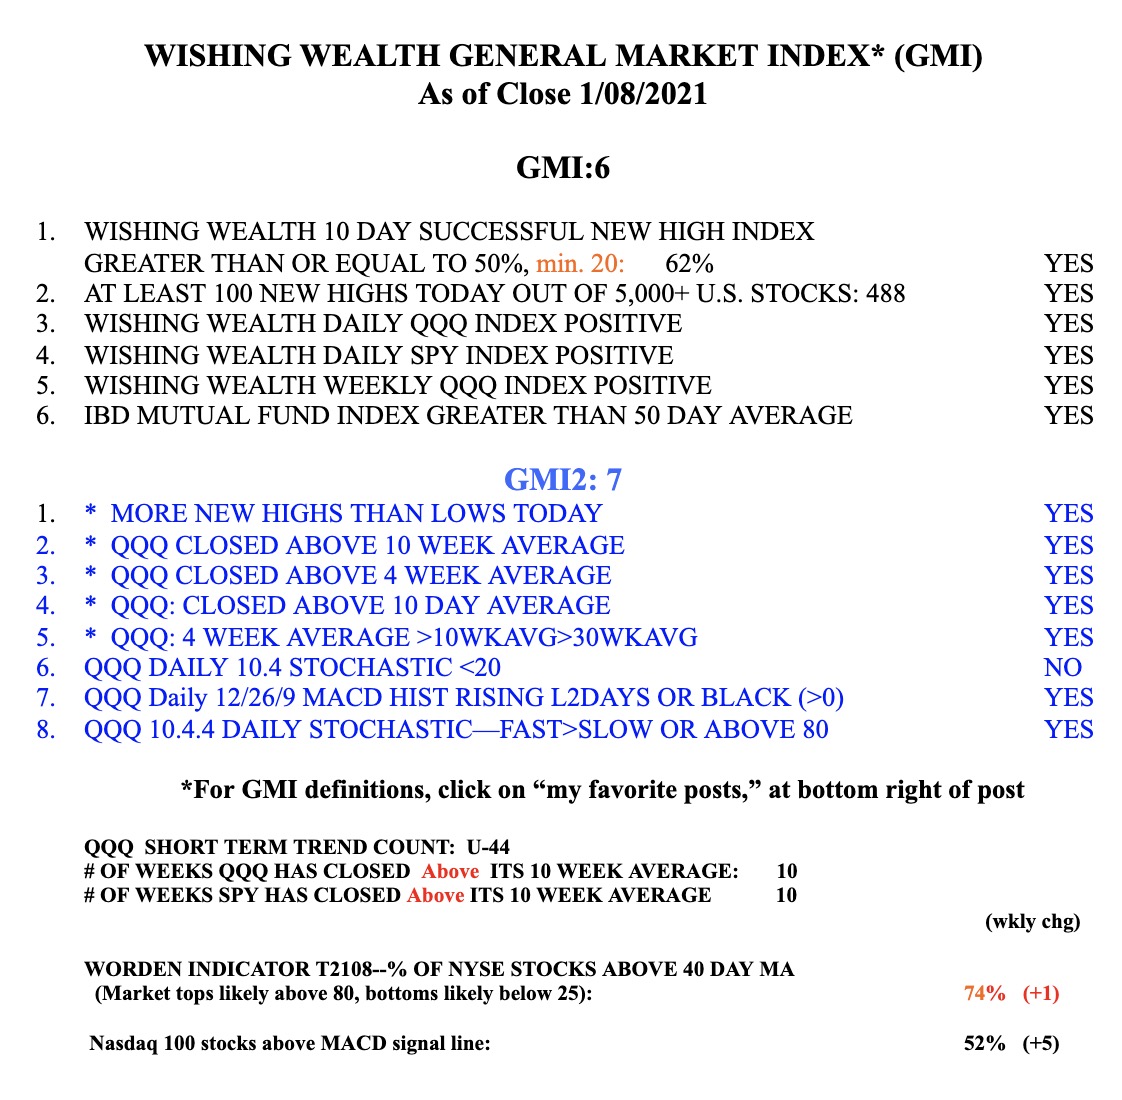
The GMI s 6 (of 6) and on a Green signal.
Aloha Dr. Wish, I too am a professor and just recently retired. I really appreciate what you do to educate your students and readers. I hope in retirement you can keep your blog going and, perhaps write a book, and or, do YouTube.
Aloha and thank you for your kind sentiments.