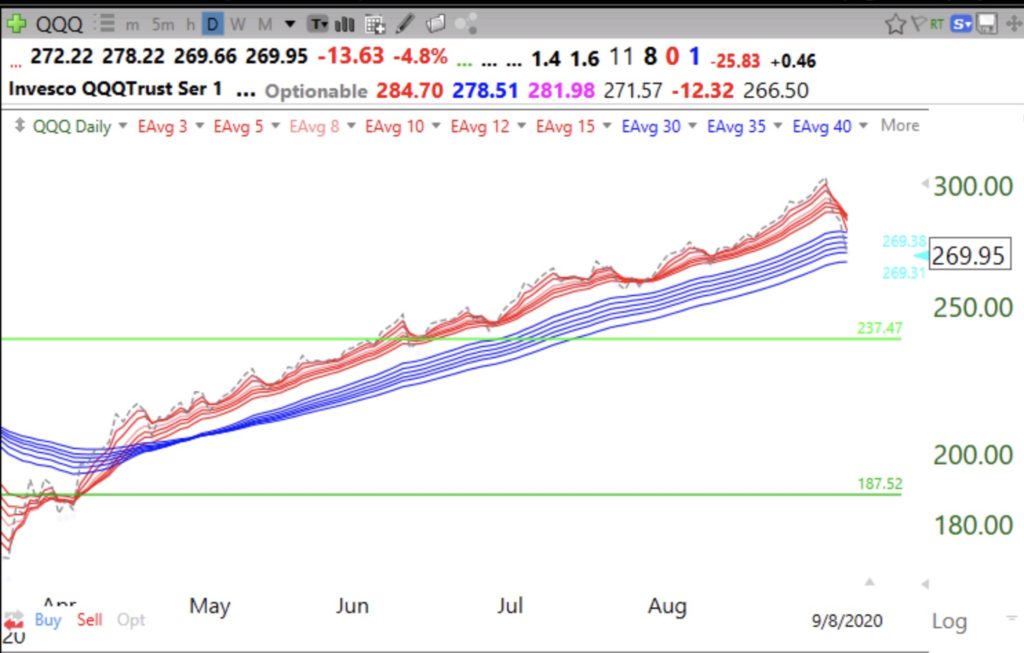
Daily red/white/blue (RWB) up-trend pattern is when all short term exponential moving averages (red lines) are rising above all longer term averages (blue lines) with a white band separating them. Gray dotted line shows daily close, which leads averages up or down. Note dotted line is now among blue lines. When daily close retakes the red lines it could signal a possible start of a new up-trend. A major down-trend occurs when one has a BWR pattern, last seen in early April.
