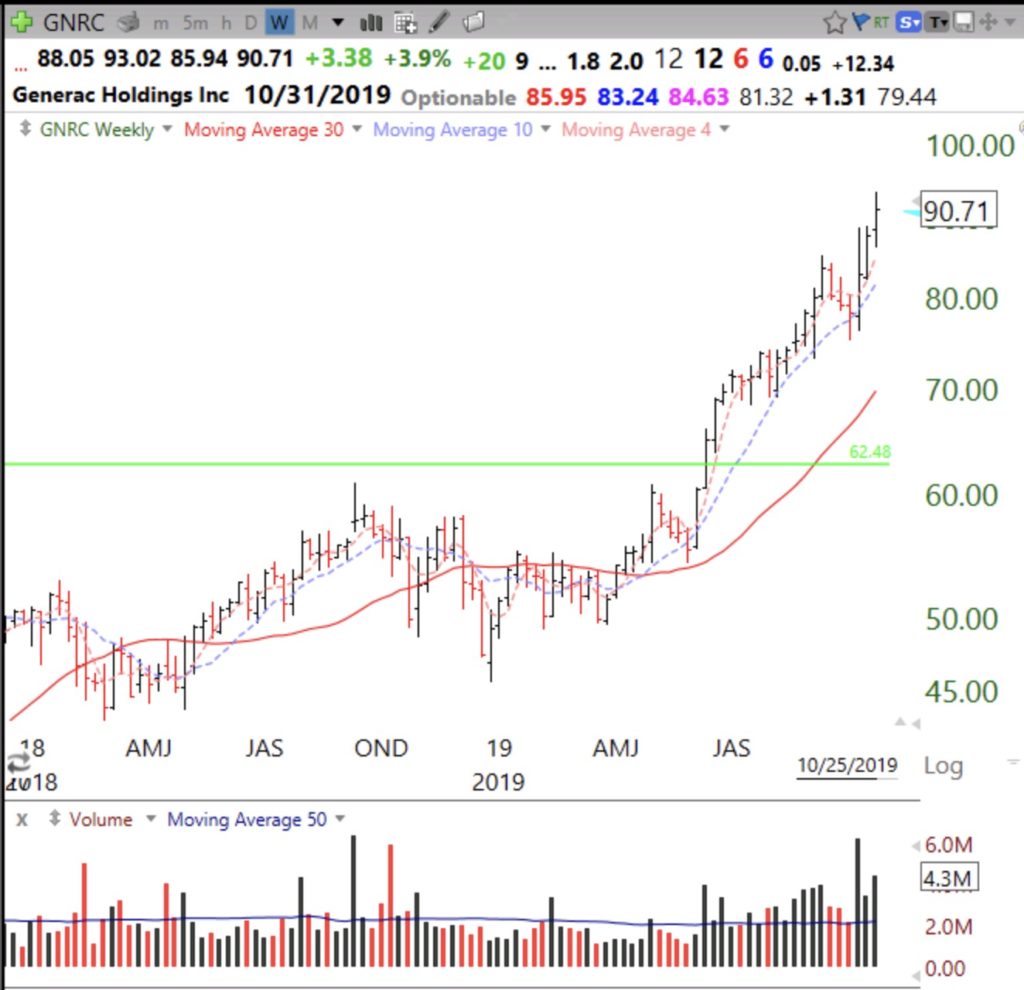
All of these stocks have doubled from their lowest price the past year. Most are near all-time highs. This weekly chart of GNRC shows it had a GLB (green line break-out) in June; their sales may be boosted by increased purchasing of their generators during the hurricane and the current turn off of electricity in parts of California. GNRC reports earnings this week. One of my rules is to buy a GLB in a stock that has already doubled. Note that GNRC has not closed below its 10 week average (purple doted line) since the GLB. That would be a sell signal.
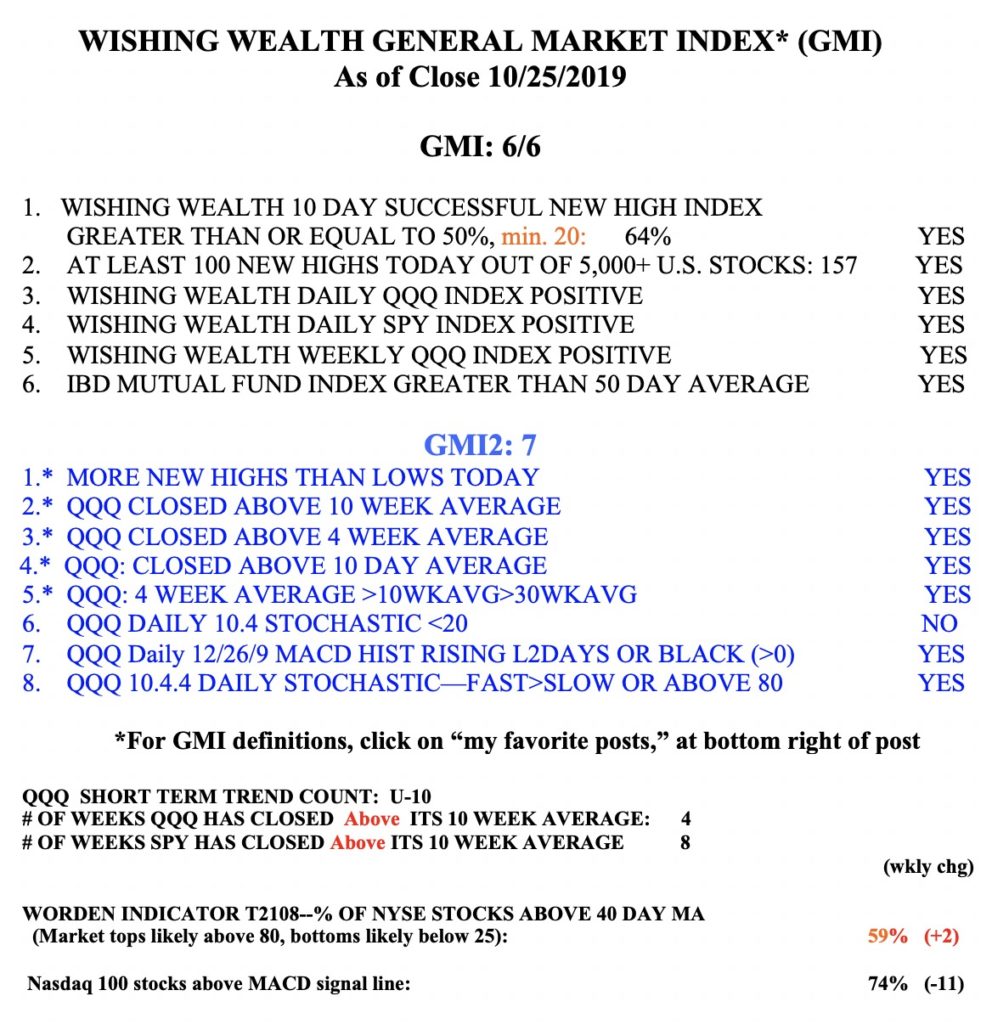
The GMI remains Green at 6 (of 6).


1. In your post it says: “for GMI definitions click at the bottom right” I can’t find that. Where would I find that?
2. about 3 days ago I emailed a list of questions. I found answers to a couple of them. I suggest that having introductory article or video would be a big help. Do you have one?
Try the glossary.