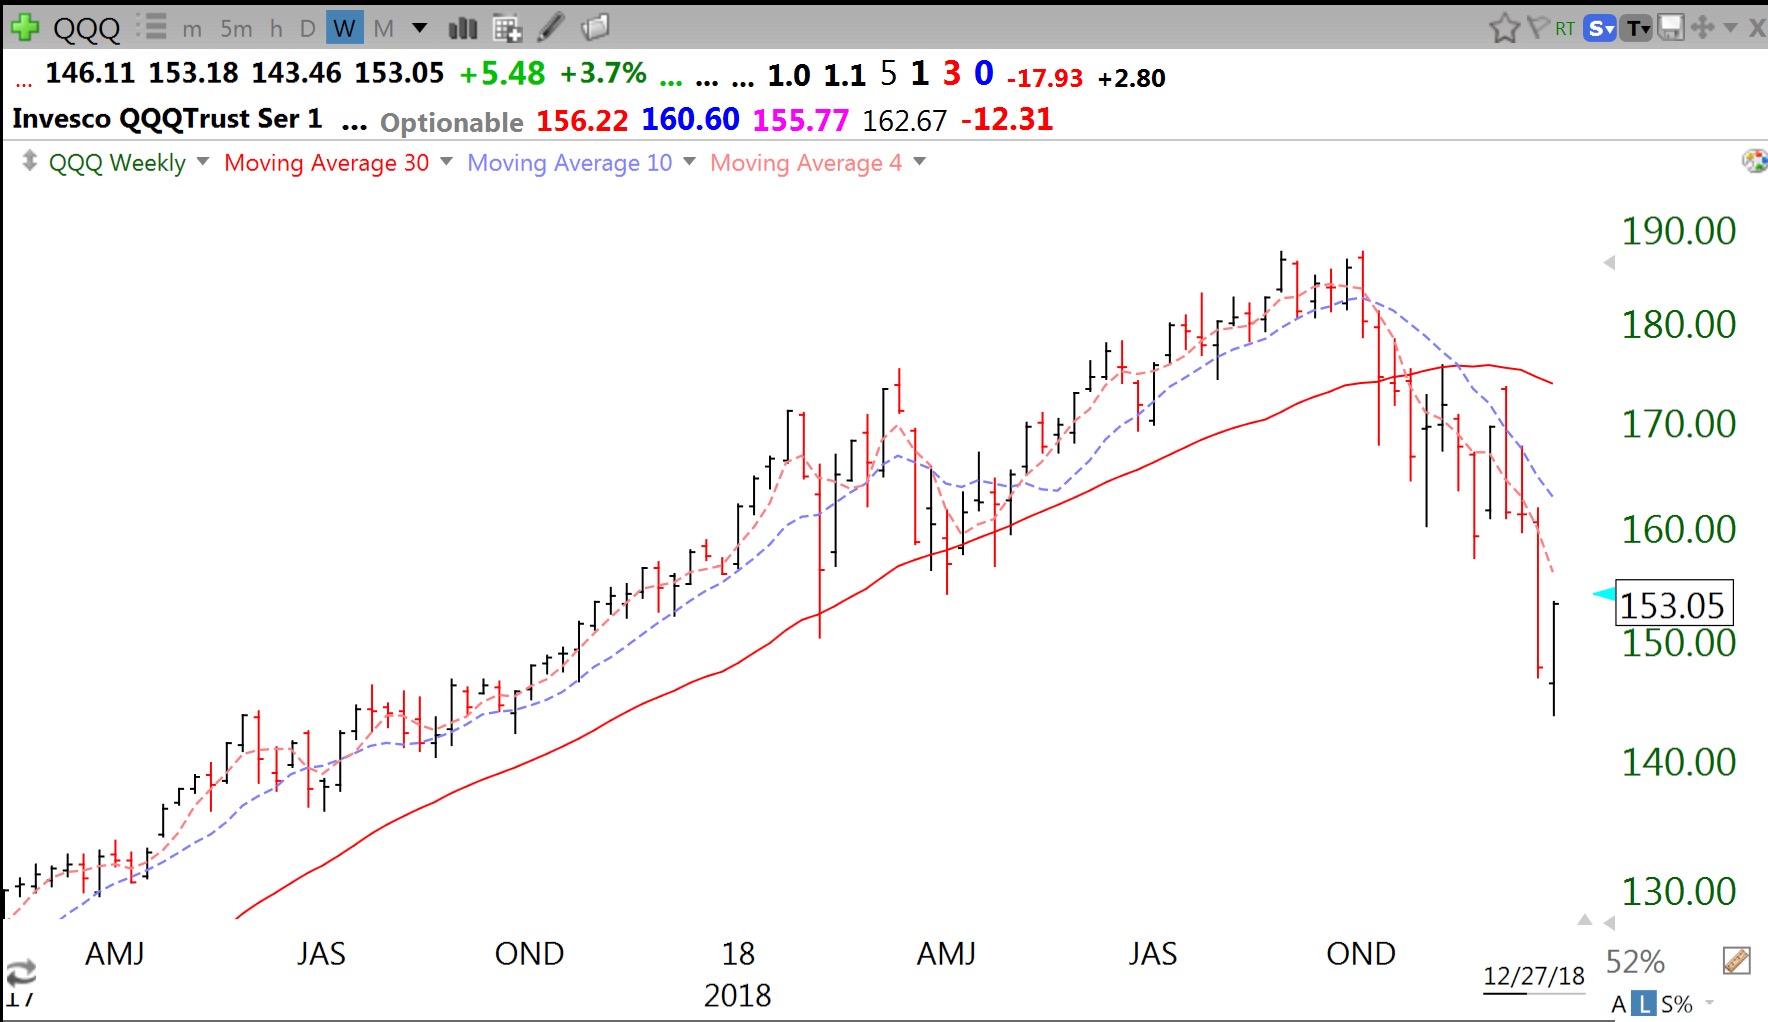
Over the past 50+ years I learned that the best way for me to determine the general market’s trend is to apply Weinstein’s Stage Analysis to the weekly chart of the major averages. Mark Minervini’s book, listed in the lower part of this blog, provides a modern update to Stage Analysis from when it was first proposed by Weinstein in the 80s (see book list below). This weekly chart of the QQQ shows a Stage IV decline in progress. A lot of bear markets have lasted 10 months or so and I suspect that this decline is just getting started. The 30 week average (red line) is now curving down. The 4 week average (red dotted line) is below the 10 week average (blue dotted line) denoting considerable weakness. Compare the pattern of these averages to that in the long prior up-trend where the reverse was evident. It is very likely that the QQQ could retrace to the 4 and/or 10 week averages and still be in a down-trend. When the QQQ rises above the 10 week and then closes above the 30 week and turns up, I will be confident of a new up-trend. Patience is the hallmark of great traders.

Thank you
I’ve asked essentially the same question before, so please excuse the repetition. When, if ever, during a stage IV decline would you consider going short?
Looking for SPX 2650-2700 before heading back down.
I sometimes short a stock or index with an overbought stochastic that is turning down. A bounce below a declining 10 week average is also something I favor.