I have been writing that strong stocks often rise during the last week of the quarter as mutual funds spruce up their portfolios to look smart in their quarterly reports sent to investors. The indexes sold off on high volume at the end of the day on Friday and I am waiting to see what happens this week now that the quarter is over. The SPY and DIA are weaker then the QQQ and up against some technical resistance. Also, having passed day U-78 in the current QQQ short term up-trend, we are approaching the longest up-trend since I began recording this in 2006 (at U-88). I therefore would not be surprised to see some short term turbulence this week….
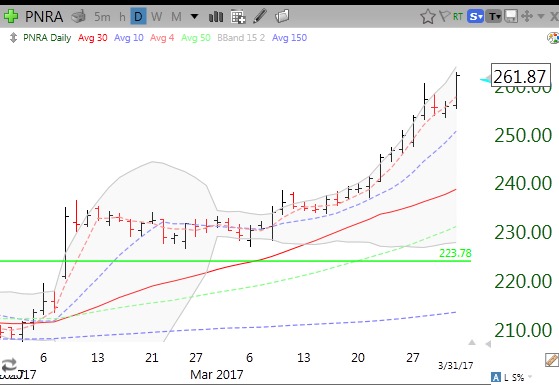
Chart patterns often times mislead us into thinking that obtaining gains is easier than it is. Often times a stock has a major break-out (GLB) only to have it vacillate and consolidate before it takes off. On a chart the consolidation looks small and rapid but in reality it often means that we buyers need to have incredible patience to hold on. The greatest trader, Jesse Livermore, said that it was his sitting tight not his trading that made him big money. When you see on a chart that after the GLB a stock eventually continued its rise you think that patience with the position must have been easy. But in fact holding on in the days and weeks after a break-out is psychologically very difficult because we do not know what the outcome will be. This daily chart of PNRA provides a good example of this situation. After a green line break-out (GLB) to an all time high (ATH) on above average volume PNRA went sideways for about 23 days. Would you have held on through its ups and downs and all of the media pundits’ predictions of a market top during PNRA’s consolidation? It appears so easy to wait only when we can see how the story eventually ended! (Trading is mostly psychology.)
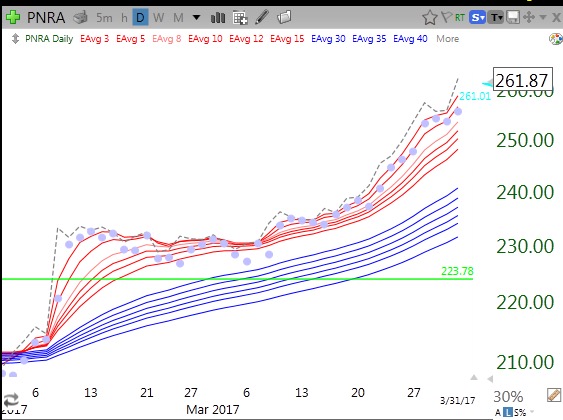
This is one of the reasons why I like the daily RWB strategy that I have been describing lately. It helps me to cut through the daily noise. PNRA remained in a nice RWB pattern after its GLB. It never closed below all of its red lines (RLC never equalled 0). There were 4 days when any daily low (indicated by purple dots) was below all of the red lines and in the white space between the two sets of lines, but PNRA always rebounded to close within the red lines (dotted line tracks the daily close). Hence my preference to use mental stops sometimes and to check my positions around 15 minutes before the close each day. But even a close below all 6 red lines is not necessarily the preferred exit point. Alternatively, I might just reduce my position or wait for a close below at least one blue line. As long as the RWB pattern is in place with any white space between the red and blue lines the stock is in an up-trend. Also, after a GLB, I must sell if the stock closes back below the green break-out line. (When a set-up fails to proceed as expected, I exit.) PNRA never breached its green line……
FIZZ is a perfect example of the RWB of a stock that never hesitated after its GLB. Note that FIZZ has closed above all of its 12 daily averages for weeks, even before its GLB. No daily low has even occurred in the white space! Its pattern is still a perfect 12/12/6/6.
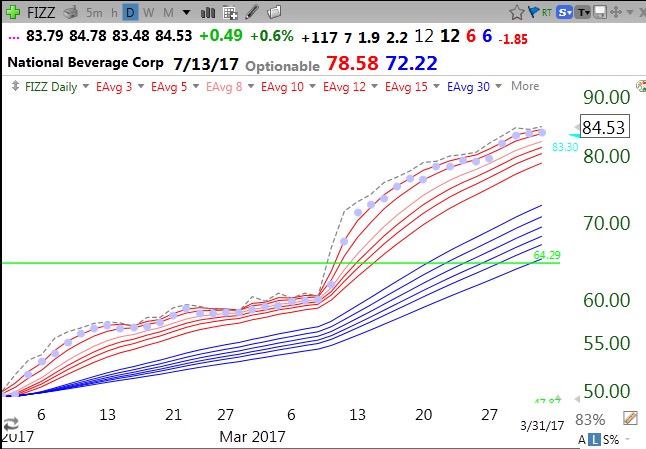
Had I only traded FIZZ on the day of its GLB or sooner……
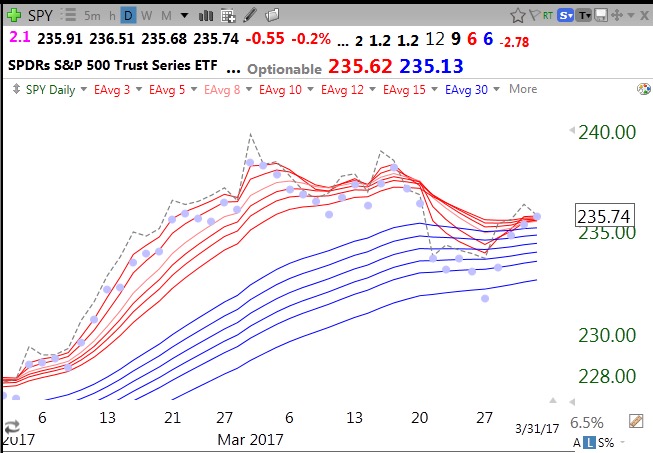
The reason I am very skeptical of the health of the overall market is this chart of the SPY. The chart has a 9/6/6 daily pattern which shows that only 9 of the 12 daily averages line up perfectly and SPY closed Friday above the 6 red lines and 6 blue lines. However, the RWB pattern broke down last week and the red lines are back floating just a little above the blue lines. Note the diminished white space between the red and blue lines. Whether this minimal RWB pattern can survive will tell me the likely short term direction of this market. The 12 (12/9/6/6) shows me that all 12 weekly averages line up perfectly on a weekly RWB chart, indicating a strong longer term pattern. The DIA has a similar pattern, not shown. But remember, by definition, the short term trend always turns down before the longer term trend.
Note the stronger RWB pattern in the QQQ (12/12/6/6), reflecting strength in the non-financial and tech stocks contained in the NASDAQ 100 index.
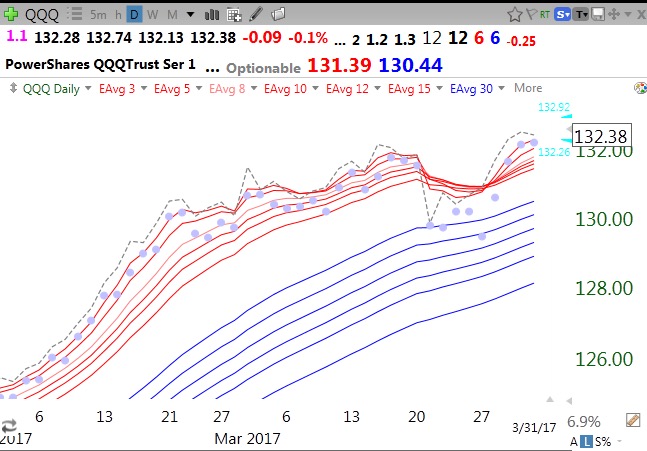
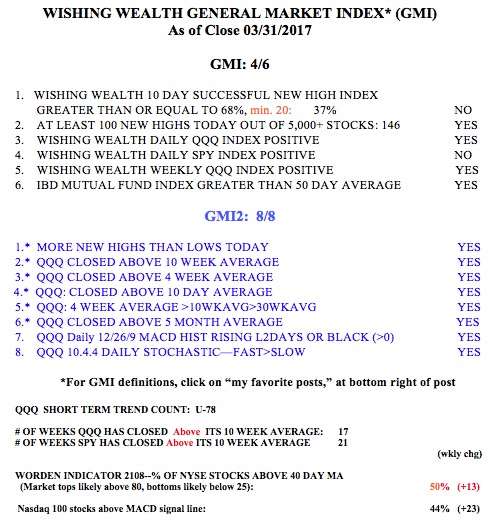
This explains why the GMI, with its components focusing on the QQQ, remains at 4 (of 6).