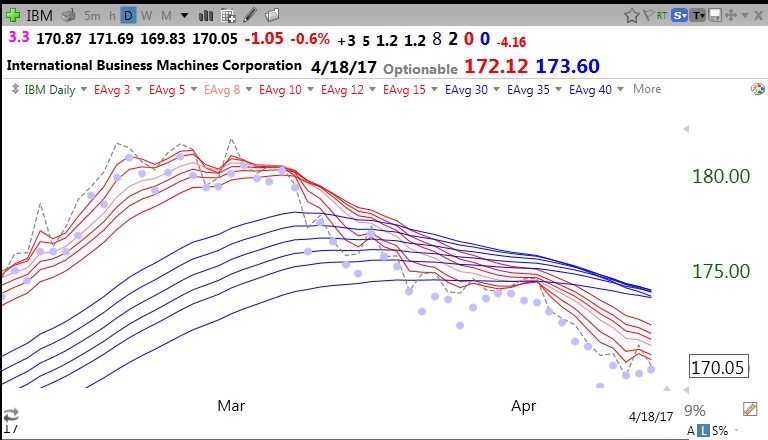
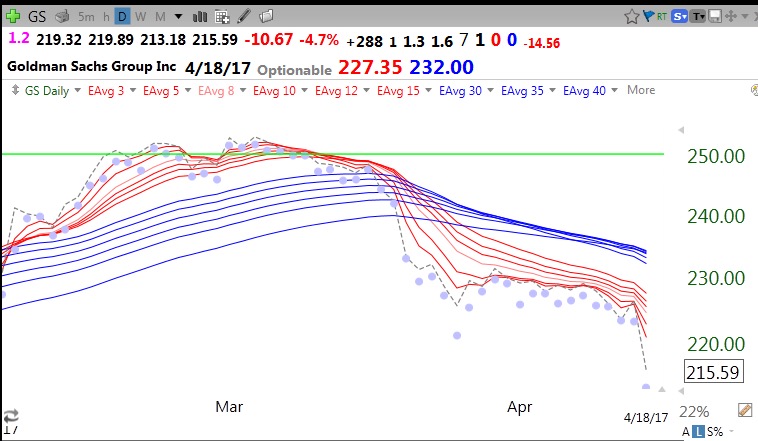
The RWB daily charts would have warned one to get out of IBM and GS long before their earnings inspired declines. Note when each went from RWB up-trends to BWR down-trends with 0/0 patterns.
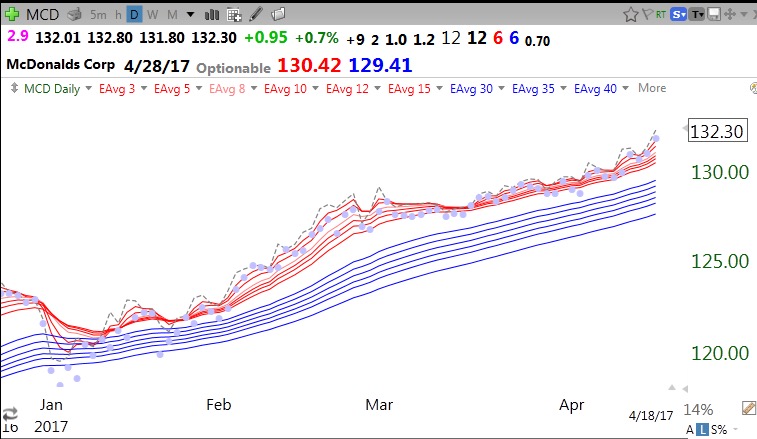
It’s all in the chart! I own RWB stocks and get out of BWR stocks. Note how nice the chart is for MCD–pure RWB and a perfect 6/6 pattern.
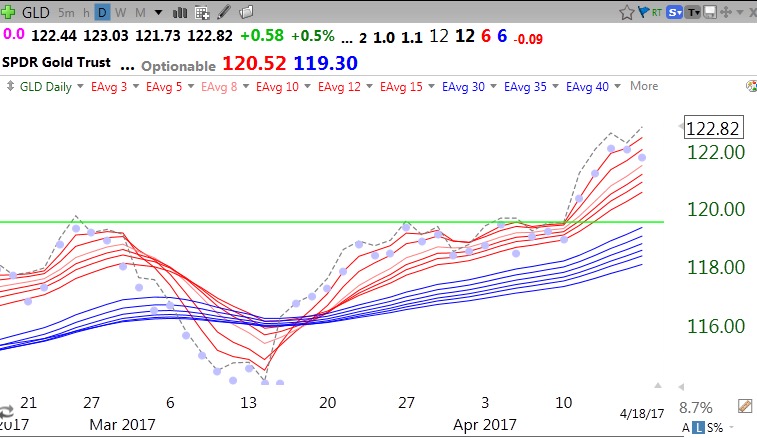
And of course there is GLD, 6/6.


What dates would RWB have taken you out of IBM & GS and into MCD?