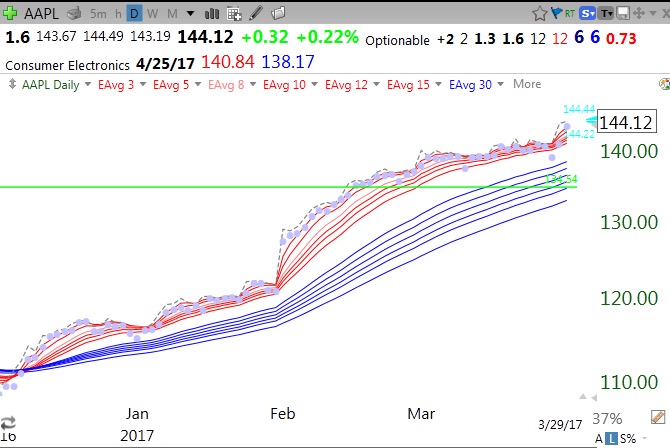
AAPL has been RWB since December and is currently 12/6/6. Note AAPL has not closed below its 6 red lines since December. Why should anyone have sold during this period? Hence the value of the daily RWB strategy–it keeps me in rising stocks.
Stock Market Technical Indicators & Analysis
AAPL has been RWB since December and is currently 12/6/6. Note AAPL has not closed below its 6 red lines since December. Why should anyone have sold during this period? Hence the value of the daily RWB strategy–it keeps me in rising stocks.
Dr. Wish, Do you use TC2000 to draw the RWB and 12/6/6 charts? It would e great to know how to do that with all my stocks.
Thanks,
Doug
I’ve posted here before about testing your RWB strategy.
I’ve tested all the permutations of entering/exiting based on the TLC, RLC, BLC counts. What I have found that works best, and is really the ONLY one that beats Buy & Hold is this: Buy when all the short EMAs are above the lowest long EMA & Sell when all the short EMAs are below the highest long EMA.
This is testing with the daily EMAs, on a number of stocks, like AAPL, which “should” be good trend-following stocks.
Many of the other permutations still give big draw-downs, with lower return. That is a bit different than what is being suggested here.
All charts on my site are drawn with TC2000. Go to their site, tc2000.com and start listening to their free tutorials. Adding plots of multiple moving averages is very easy. I compute all indicators using TC2000. Once you start using it I can help you with the formulas.
Thank you for all of your analysis. What your backtests leave out are all the decisions I make using fundamentals and other research. The RWB method is a way of selecting entries and exits once I am interested in a company. I am not a blind empiricist in my approach.