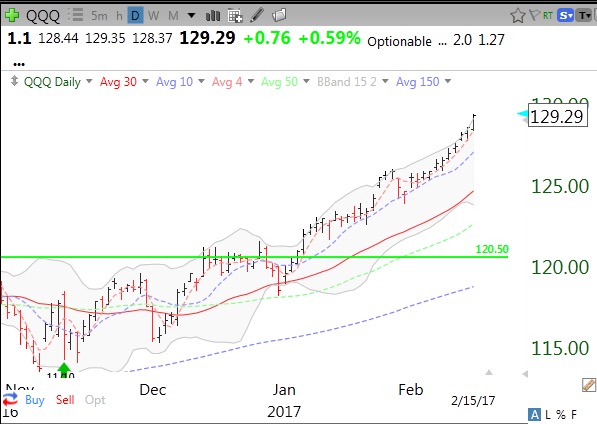
Whenever a daily stock chart shows a stock or ETF going vertical, I usually get off. Both the SPY, QQQ and DIA have vertical patterns. I have therefore become very defensive. Take a look at this chart of QQQ.
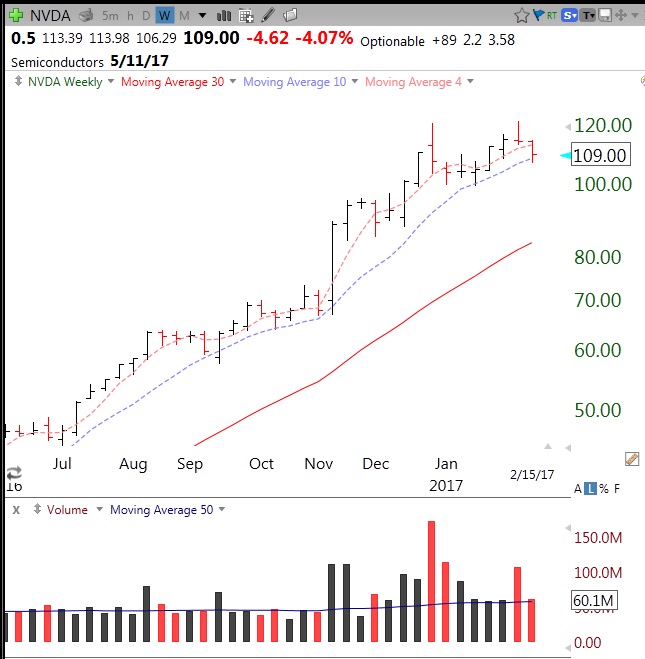
I am also concerned that NVDA, a leader, could not go to a new high on good earnings. There are signs of high volume institutional selling in NVDA. It shows up clearly in a weekly chart. Look at the huge red volume spikes of selling at the two peaks. Failure to retake these peaks would set up a major decline in the stock–and probably the market….


Major indices could use a break…RSI is showing overbought levels. Might be time for small-caps to shine a bit.