It is at times like these when it helps me to look at longer term charts for perspective. This monthly chart of the QQQ back to 2000 shows that the current market is not yet showing signs of a major decline. (The DIA and SPY charts look similar.)
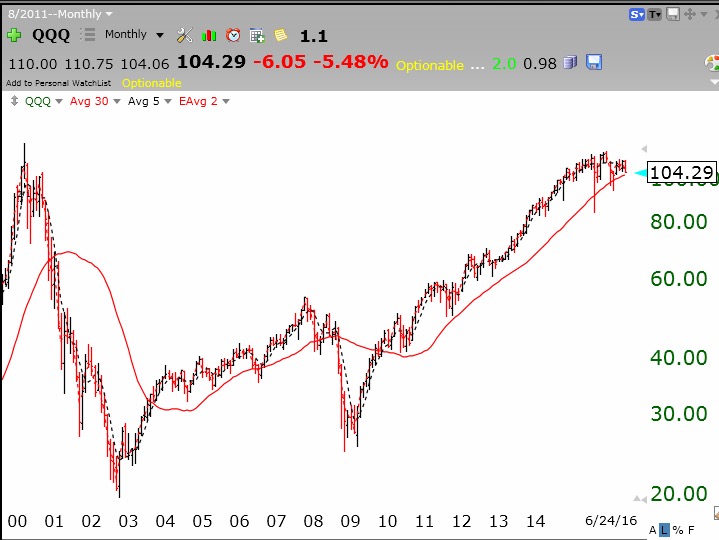 The QQQ would have to decline below recent support levels reached last February, around 94, to make me think this might turn into a bear. (I dismiss the prior “flash crash” low of August, 2015 as a man-made, contrived aberration without technical significance.)
There are a few things making me think this market could bounce later this week. Bloody Fridays often lead to bloody Mondays as people look at their declining account balances over the weekend and sell stocks in a panic at the open. But three other signs make me think we may get a strong bounce: 1) the put/call ratio is at 1.17, a level denoting option traders’ extreme fear, which occurs typically at bounces/bottoms; 2) this week is end of quarter mutual fund window dressing when funds buy up the stronger stocks so their quarterly portfolio reports look good; and 3) on last Friday the most NASDAQ 100 stocks (66) traded at or below their lower 15.2 daily Bollinger Bands since the market bottom of last February. Do these indicators guarantee a strong bounce next week? No, but I would not start selling Monday morning…………
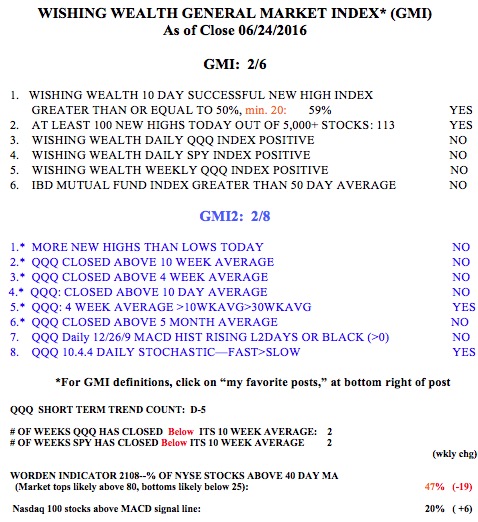
The GMI is now at 2 (of 6) and will issue a Sell signal at Monday’s close unless the markets strengthen.