HELE has been a super rocket stock since 2010. This weekly chart shows that HELE has resumed its strong RWB pattern after coming out of a base in October. HELE gapped up and broke above its green line top to an all-time high on huge volume on October 9. It has retested its GLB several times since.
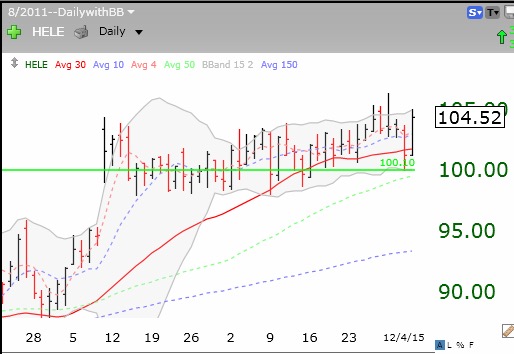
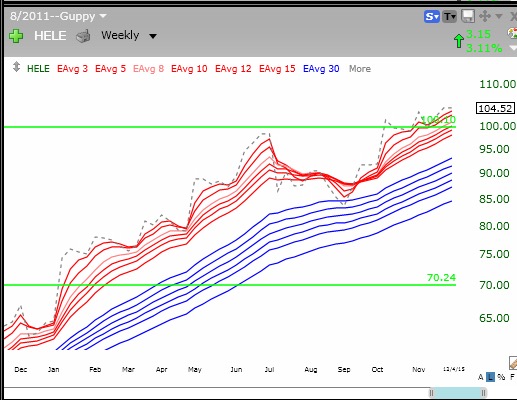 Last week, HELE again bounced off of its green line top and may be getting ready to begin a new advance. The way I would play such a pattern would be to buy it and place a sell stop around $99.90. If I am wrong I am risking about a 4-5% loss. If I am right, I might catch a ride on a rocket! We’ll see this week if this turns out to be a timely set-up.
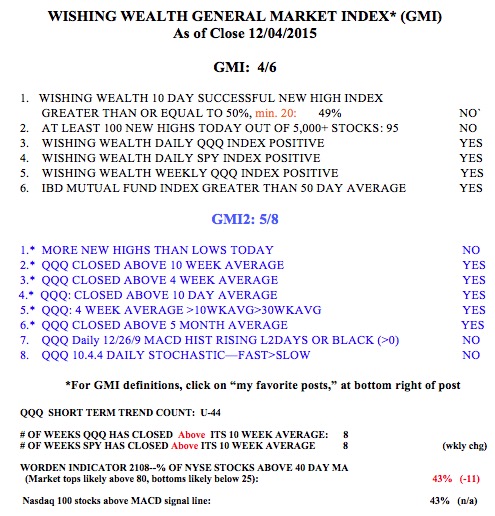
 How did I find HELE? It came up in one of the rocket stock scans I built in TC2000. It identified 15 stocks out of about 5500 that had my desired pattern of a rocket stock (RWB) and bouncing off of support. (The other stocks were: ICE, USCR, PNFP, ALKS, TTC, RAI, NDAQ, LFUS, THG, UFCS, NXST, PRA, DLR and ADP. Of course, these need to be researched to see if any are worthy of purchase.) To learn more about my methods, go to my free December 2012 TC2000 webinar link on the right of this post. (By the way, I am doing an AAII workshop in Virginia this February–more details to come.) Whether HELE rises this week will depend a lot on the general market’s trend. Here is the GMI table. The GMI remains on a Buy signal.
I seldom get a very unexpected result from my scans. However, just for fun, I ran my scan for RWB stocks bouncing off of support focusing only on industry indexes. I found that only one industry, financial exchanges, came up! This monthly GMMA chart shows a clear RWB pattern for the financial exchanges index. (I am just discovering the benefit of a monthly GMMA chart that shows the longer term trends.) Clearly, the financial exchange index has been in a strong RWB pattern for almost three years.
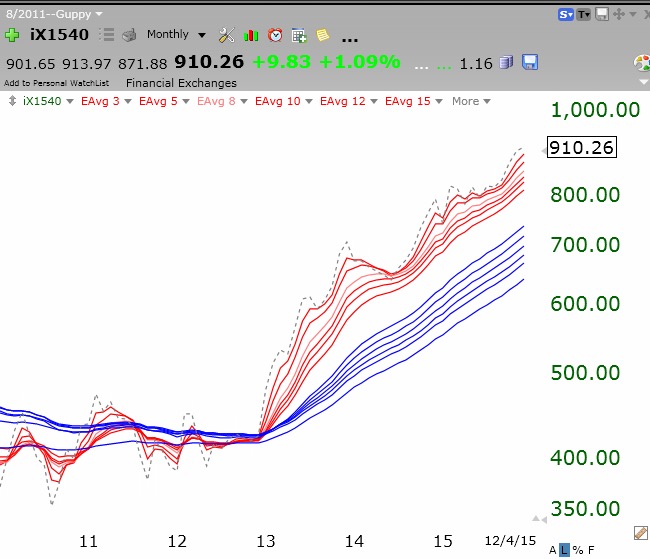 However, the weekly GMMA shows that this index recently emerged from a year long consolidation in November, 2015.
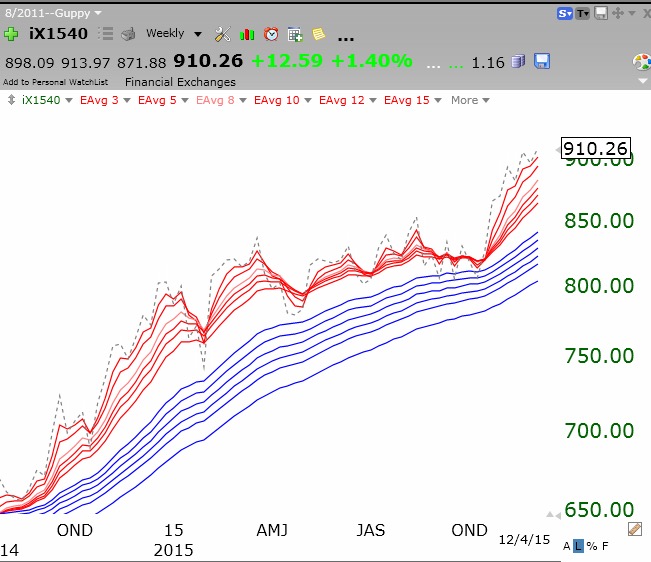 What is driving this index? Perhaps an environment of rising interest rates increases the business of financial exchanges, as does the trading of commodities, which are getting very volatile, reflecting oil’s decline? Higher trading activity and margin interest rates will lead to higher profits for financial exchanges. The 4 stocks (out of 5) measured by this financial exchange index that all have weekly RWB patterns are: CME, CBOE, NDAQ and ICE. This is very interesting food for thought and may be worthy of my own financial exchange…….