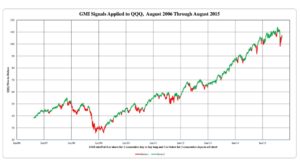
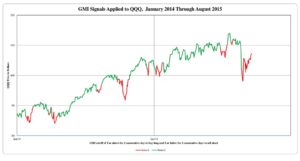
My QQQ short term trend indicator is back to a down-trend, after only 2 days of an up-trend. This indicator is focused on the very short term trend and is different from the GMI. I have said that I trust a change in my short term trend direction only after it lasts 5 days. Below are daily charts of the QQQ, colored according to the GMI Buy (green) and Sell (red) signals. While not perfect, the GMI gets me out of significant down-trends and back in during up-trends. Note that the GMI has been on a Sell signal since the market close on August 24. I am mainly in cash in all of my accounts. (Click on charts to enlarge.)


Didn’t the signal go to a Buy on Sept 20, 2015?
No! I said the QQQ short term trend count had turned to an up-trend. That is not the GMI.
Sorry for the post above, you explained it perfectly in the blog post!