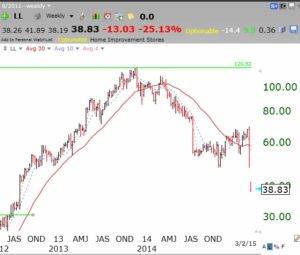
If you watched 60 Minutes on Sunday night you know why LL fell out of bed on Monday, down -25%. But should anyone have been holding LL stock recently? My students would have probably been out of LL simply by looking at a weekly chart and applying Weinstein’s Stage Analysis technique. LL was below its 30 week moving average, which had topped out a year ago. LL closed below its 30 week average last week after spending a few weeks above it in January and February. This could have caused a head-fake as a possible beginning Stage 2 advance, but note that LL was below its final green line top at around $120. I tell students only to hold stocks above a stock’s last green line top. The solid red line in this weekly chart is the critical 30 week moving average. Notice the strong Stage 2 up-trend throughout all of 2013. I only own stocks that are in Stage 2 up-trends.
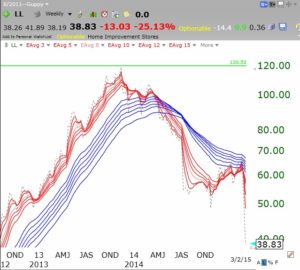
 I decided to also look at the weekly modified GMMA chart for LL. I was struck by the fact that this chart did not show the recent head-fake in January and February. The RWB pattern had clearly ended in 2013 and we never got a RWB pattern since. The GMMA chart clearly provided the better indication that one should not have been in LL since at least June, 2014, when a bearish BWR pattern became evident. Beware the whites of their charts!

Your previous post said, ” I was successfully able to stay out of the market during most of the 2000 and 2008 declines. After a bottom was in I reinvested on the long side.”
After a decline to you still look to buy green line tops or do you modify your approach to buy stocks that have declined?
See my next post on GMCR