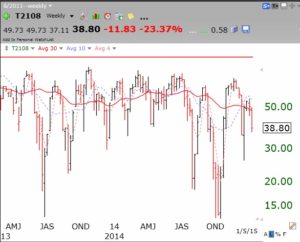
I looked back at the length of QQQ short term down-trends since 2006. About 40% have lasted 5 or fewer days and another 16% lasted 6-10 days. So there is about a 50/50 chance this short term down-trend could end within 2 weeks. However, one more weak or flat day and the GMI will flash a new Sell signal. GMI sell signals are more significant and can indicate a longer term down-trend. Note the GMI-2 is now 0 and the T2108 has fallen to 39%. I start looking for a bottom when T2108 is below 20%. This weekly chart puts T2108 in context. It still has a long way to fall.
