In response to a comment left by a reader who questioned the value of the GMI, I am posting a visual of how the QQQ behaved since 2006 while the GMI was on a Sell (red) or Buy (green) signal. You will see that the GMI got me out of the major declines. The cost was that sometimes the GMI gave a false signal and got me out at the end of a short decline. It then got me back in. I think this is a fine trade-off to make in order to avoid the pain of a serious decline. I am a chicken when it comes to trading. (Click on chart to enlarge.)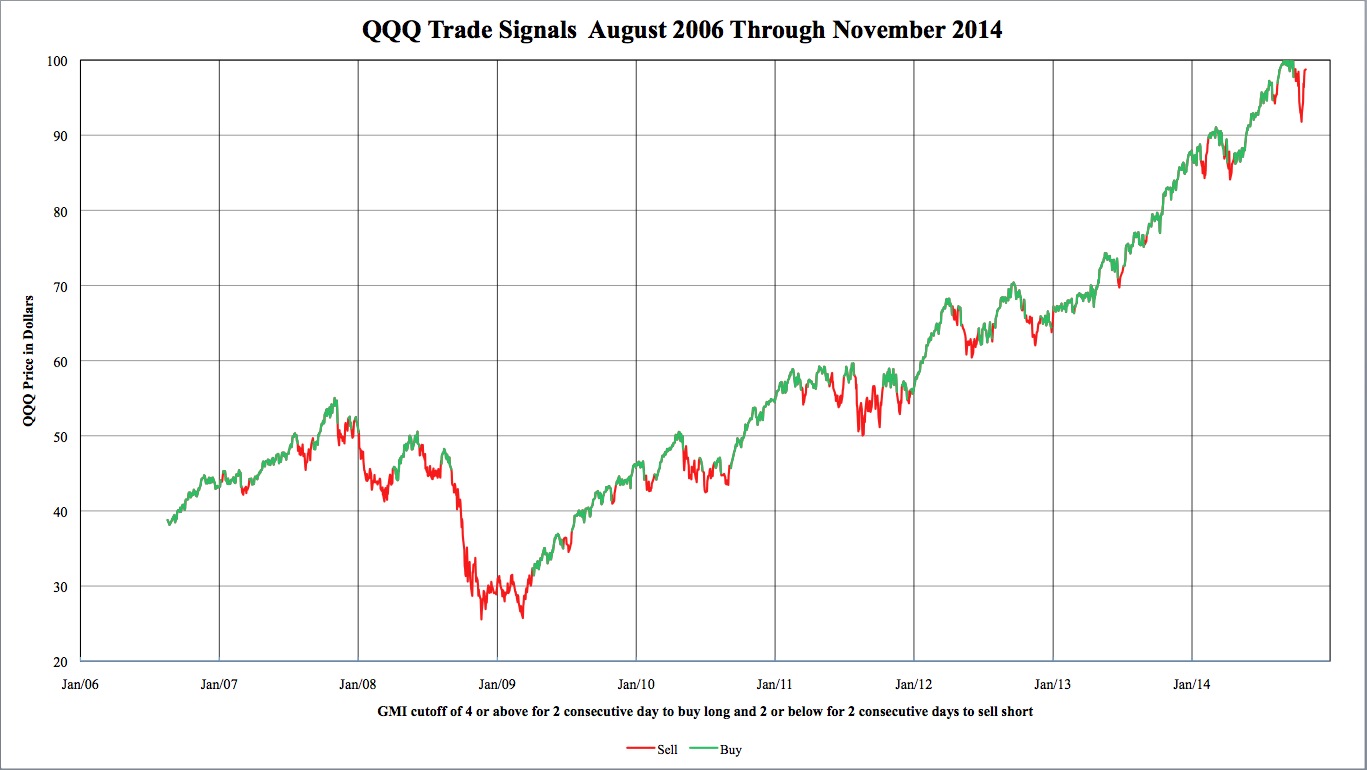 The GMI is now back to a Buy signal as of Monday’s close. Two consecutive closes above 3 yield a Buy signal. Monday was also the second day of the new QQQ short term up-trend.
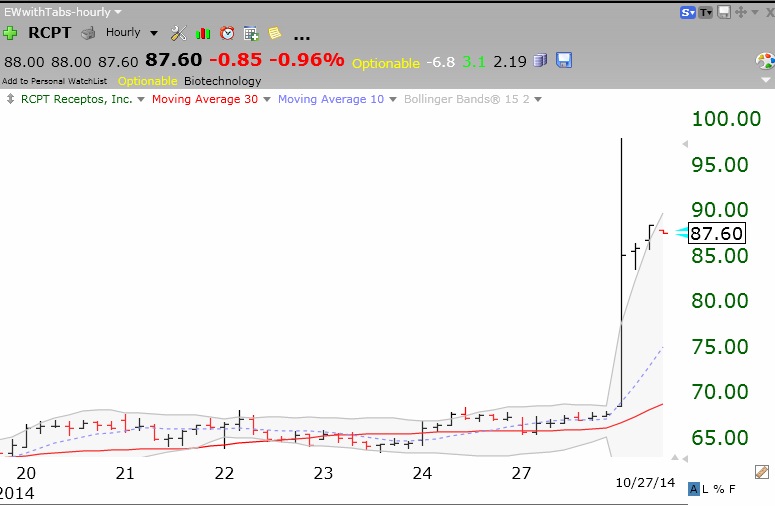
On September 10, I wrote that RCPT had had a green line break-out (GLB). The stock exploded up after hours on Monday and is trading up about 25%. Check it out on Tuesday. After the close RCPT announced good results on their colitis treatment. This is why technical analysis has value. Somebody apparently anticipated this news and bought into the company huge over a month ago! Their buying was evident in the chart. Here is its hourly chart after Monday’s close. Expect RCPT to open way up on Tuesday.
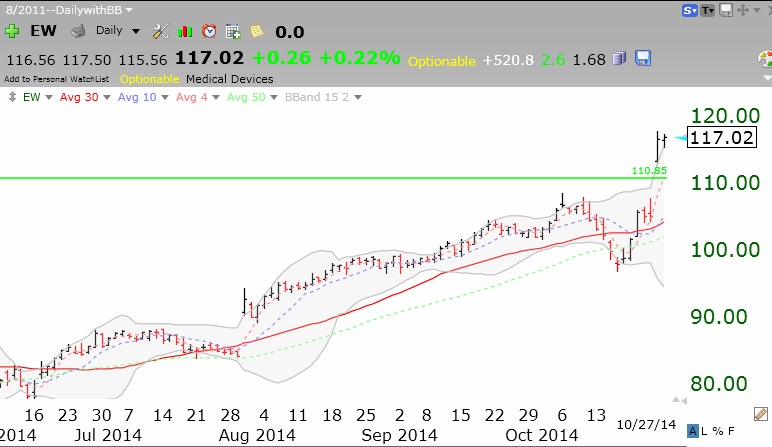
 Speaking of GLB stocks, EW had a huge break-out last week. Check out this daily chart of EW.
The GMI is still showing sell! Am I missing something?
Dr. Wish, My conclusion is that your GMI is a more accurate timing system than most other systems that I’ve seen (e.g., IBD, VectorVest, and Fibtimer-to name but a few). Additionally, your open trading is as brave as Cramer. And your price cannot, I repeat, cannot be beat. Many, many thanks for all you have shared with us over the years. (My apologies for posting this yesterday, as I intended to post it here.)
Also, your QQQ Trade Signals chart is great!
Dr. Wish. The GMI since 2006 chart is very compelling, could you also post a comparison in dollar terms using let’s say $10,000 initial capital and compare the GMI strategy to plain old buy and hold during that same period? I believe that including transaction fees your strategy should still be ahead but it would be great to confirm it. Thanks
I can’t believe someone questioned the value of your system. I’ve never posted here but follow you everyday and find the GMI and GMI-2 invaluable.
Dr. Wish I have been following your site for almost two years, after hearing you speak at the AAII meeting in DC. I believe your calls are as close to the market moves as anyone else in the industry. Thank you for the info and please keep up the excellent work.
It’s commendable that Dr Wish puts this information out there, for free. But to the poster who can’t believe someone would question it: that is dangerous thinking. You should critically analyze and question everything upon which you would base your investment decisions.
The problems here are multiple: a test back to only 2006 is insufficient to evaluate the goodness of a timing strategy. You are covering one major market drop and then a 5 year bull market. But how does it work over different periods? How does it work when you have a period like the 1990s?
The system underperforms buy & hold since 2009, so for someone starting to use the system then the next big drop must be big enough to account for that underperformance.
Another problem is that this strategy is not testable because there are proprietary bits of information. That’s certainly Dr Wish’s prerogative to keep those proprietary, but personally I would never put money into a system that I could not independently verify and repeat. He could retire and take down the site tomorrow.
Without being able to run the numbers directly, I can’t say for sure, but from eyeballing the chart, a simple timing method of 10 month SMA crossover (ala Meb Faber) would appear to do as well with far fewer trades, and can be implemented by anyone. And with a few other implementable modifications likely does better.
If you’re going to put money to a timing system you should know the details of the historical performance (# trades, CAGR, max DD, etc. etc.)
ZZ, I find that the indicators work best as buy and *short* indicators, not buy and sell. Put close moving stops on the short side while in a bull market or on long in bear, and you’ve got a much more solid strategy that wins against both buy+hold and buy+sell.
That said, if I wasn’t able to track the market daily, I would employ buy and hold with stage analysis over a GMI-exclusive strategy, as you are correct that the GMI loses to buy and hold during long trends.
Frankly, I think it’s a mistake to look at only one technical indicator for any strategy, and nobody should be so naive as to follow the GMI blindly.
Dr. Wish, do you track your initial (small) and follow-up (larger) investments separately? If you do, does the large followup outperform the small starting investment? I’ve found the opposite to be the case, especially when on the same side as the market.
The GMI counts 6 indicators and should not be considered a single indicator.