Next week we should see strength in the leaders as we get to the end of second quarter and mutual fund window dressing.
MTSI had a green line break-out to an all time high on Tuesday. Check out this weekly chart. (I bought some.)
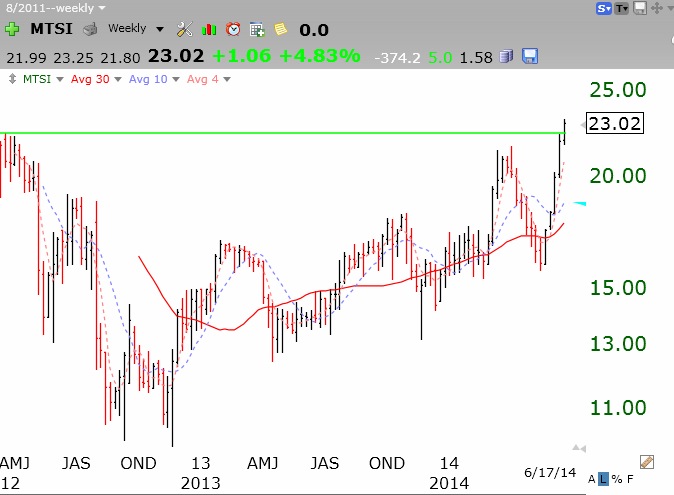 A recent IPO that forms a multi-month base and then breaks to an all time high can be a winner. If it falls back below the green line, I exit.
Dr. Wish, am I looking at this correctly? The QQQ Daily 12/26/9 MACD Histogram was 0 (Monday) and it was -0.04 (Tuesday). Wouldn’t these two values make Factor 7 of the GMI2 “NOâ€? This would mean that the GMI2 would be 6 since Factor 8 is also “NOâ€. Is that what you see when you look at the QQQ Daily 12/26/9 MACD Histogram?
Thanks in advance for your comments.
You are correct, yet again.