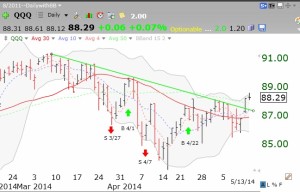
This daily chart shows that the QQQ is now above its descending trend line (green line). However, as usual, it met resistance at the upper 15,2 Bollinger Band. Today was the first day of a new short term up-trend within a longer term up-trend. Note that the 30 day average (red line) is starting to curve up, a sign of strength. The GMI has turned 5 (of 6) and remains on the Buy signal triggered on April 22nd.
