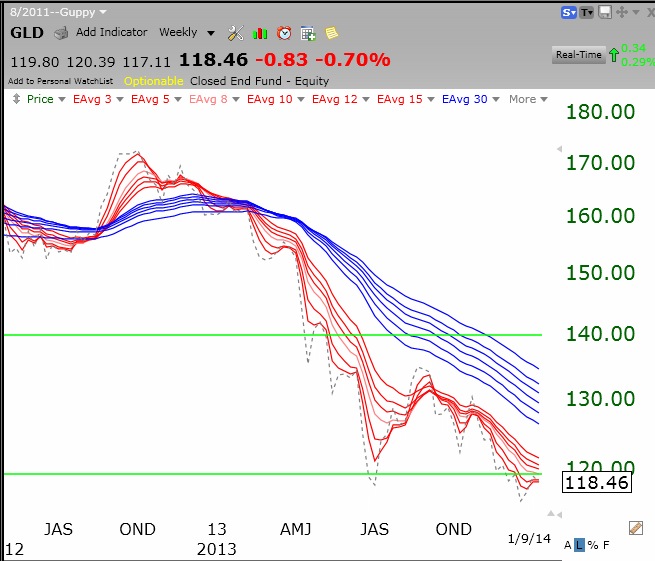
Yesterday I showed you the RWB rocket stock pattern and how it helps me to identify strong stocks. Tonight I will show you the reverse, the BWR pattern, that can keep me out of stocks in a major down-trend. You can see from this weekly Guppy chart of GLD, how it alerted me early on to the down-trend in gold. Who in their right mind should have been long gold in 2013?
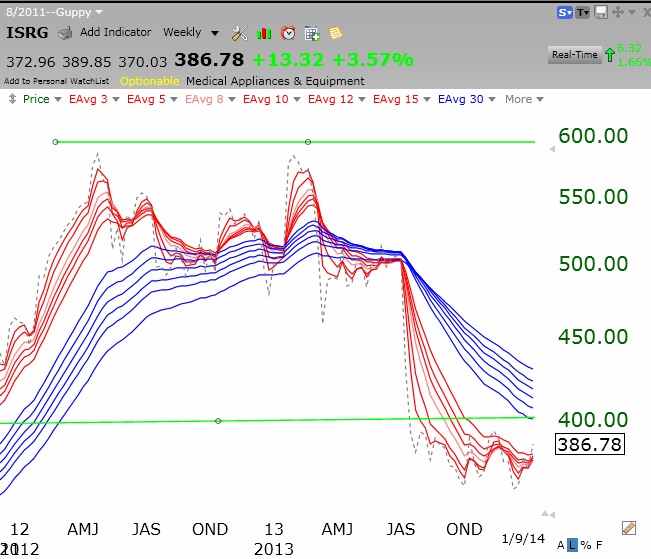
This chart shows ISRG’s transition from an RWB up-trend into a BWR down-trend.
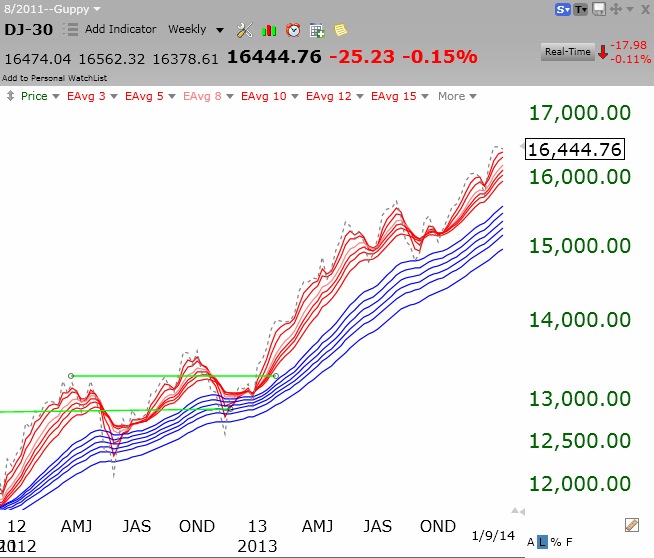
A weekly Guppy chart is all I need to determine the longer term trends of a stock, ETF or mutual fund. Guess what pattern the Dow has……..


Dr Wish can you post the pcf for the guppy chart?
There is no PCF. You just have to add the 12 weekly exponential moving averages to the price chart: 3,5,8,10,12,15, 30, 35,40,45,50,60
I also add a moving average with period of 1 to get the weekly close.