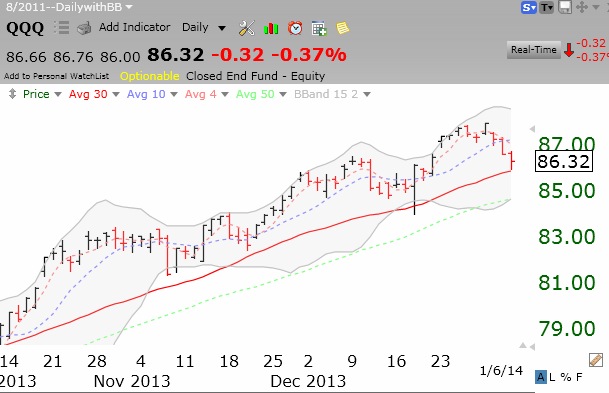
QQQ found support at its 30 day average (solid red line) on Monday. We will learn Tuesday whether it will hold or test the 50 day average (green dotted line) and lower Bollinger Band.
8 thoughts on “59th day of $QQQ short term up-trend; will support hold?”
Gmi and gmi2. Can you please explain those please?
Loading...
Dr. Wish, am I looking at this correctly? At the close on Monday, January 6, the QQQ was 86.32. The Worden TC2000 reading for the 4 week moving average of the QQQ was 86.74. This would mean that the QQQ did not close above its 4 week moving average and that factor 3 would be NO. The GMI2 would have declined to 4 out of 8. Is that what you see? Thanks in advance for replying.
Loading...
Bruce,
You can learn more about the GMI indicators by putting your cursor on “What is the GMI?†and clicking on it. This phrase is to the left and near the bottom of the image that resembles a yield sign.
Another way to find this is to select the Popular tab of web posts (on the right hands side of the blog) and select “The Wishing Wealth General Market Index (GMI).â€
The GMI2 currently consists of 8 factors. You can read a brief discussion about this in the Post Archives. Select Post Archives at the top right hand side of the blog. Then select August 2013 and scroll down the page to Aug 25 13. Click on the phrase “QQQ remains in Stage 2 up-trend; GMI2=8 (of 8).†This post describes the last time Dr. Wish changed the GMI2 to the current 8 factors. Previously it was 6 and before that it was 10.
Loading...
Rick, thanks for looking at my stats so closely. I think the problem is that my moving averages are calculated from daily closes working back 20 days from the current day but the TC2000 often shows them based on 4 weekly closes. It all depends which approach you are using. This may explain the small difference. I cannot go back and find the 4 wk ma for that date. You might want to just average the last 20 closes including 1/6 and see if it agrees with your number. A one point difference in the GMI-2 value is not that critical anyway.
Loading...
Thanks for the explanation.
Loading...
dr wish – are there any public sources of volume data for the indices? i assume the etf spy, dia and qqq only reflect the volume for the etfs themselves?
Loading...
Jason, I am not sure what you are looking for. The yahoo finance page tells you the composition of the ETF.
Loading...
wish, i meant something similar to what IBD reports in their daily articles about overall market volumes. thx!
Gmi and gmi2. Can you please explain those please?
Dr. Wish, am I looking at this correctly? At the close on Monday, January 6, the QQQ was 86.32. The Worden TC2000 reading for the 4 week moving average of the QQQ was 86.74. This would mean that the QQQ did not close above its 4 week moving average and that factor 3 would be NO. The GMI2 would have declined to 4 out of 8. Is that what you see? Thanks in advance for replying.
Bruce,
You can learn more about the GMI indicators by putting your cursor on “What is the GMI?†and clicking on it. This phrase is to the left and near the bottom of the image that resembles a yield sign.
Another way to find this is to select the Popular tab of web posts (on the right hands side of the blog) and select “The Wishing Wealth General Market Index (GMI).â€
The GMI2 currently consists of 8 factors. You can read a brief discussion about this in the Post Archives. Select Post Archives at the top right hand side of the blog. Then select August 2013 and scroll down the page to Aug 25 13. Click on the phrase “QQQ remains in Stage 2 up-trend; GMI2=8 (of 8).†This post describes the last time Dr. Wish changed the GMI2 to the current 8 factors. Previously it was 6 and before that it was 10.
Rick, thanks for looking at my stats so closely. I think the problem is that my moving averages are calculated from daily closes working back 20 days from the current day but the TC2000 often shows them based on 4 weekly closes. It all depends which approach you are using. This may explain the small difference. I cannot go back and find the 4 wk ma for that date. You might want to just average the last 20 closes including 1/6 and see if it agrees with your number. A one point difference in the GMI-2 value is not that critical anyway.
Thanks for the explanation.
dr wish – are there any public sources of volume data for the indices? i assume the etf spy, dia and qqq only reflect the volume for the etfs themselves?
Jason, I am not sure what you are looking for. The yahoo finance page tells you the composition of the ETF.
wish, i meant something similar to what IBD reports in their daily articles about overall market volumes. thx!