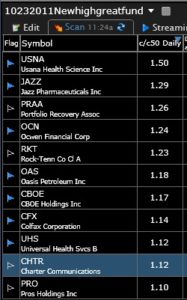
I ran my TC2000 new high and good recent earnings scan and the 11 stocks below came up. All are above their green line base tops and are therefore at all-time highs. I sorted them by price appreciation over the past 50 days. For example, USNA has advanced 50% over its price 50 days ago. Seven of the 11 have a blue flag, indicating they appear in one of the lists of stock I maintain that have been mentioned as promising stocks by IBD……
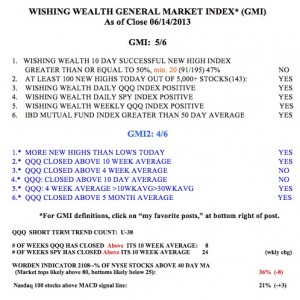
The GMI remains at 5 but my short term indicators are weakening. A close of the QQQ below 71.55 might turn my short term indicators negative. Stay tuned. I remain cautious and am hedging my long positions with some SQQQ (leveraged bearish QQQ ETF).


Regarding your use of flags in tc2k to mark ibd stocks, doesn’t this preclude using flags for any other purpose?
How do you manage this?
Yes, but I can re-create them anytime if I must.