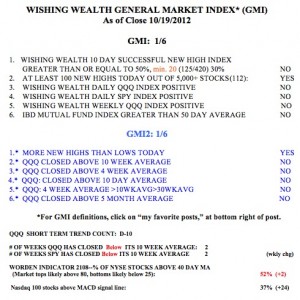
From some of the questions I am receiving from readers, I think it best to clarify my market timing strategy. I have two types of money, my IRA and margin accounts in which I am free to time the market versus my university pension which is invested in mutual funds that I cannot trade in and out of at will. The first group I call my speculative money and the second group is my more conservative money.
When my QQQ short term indicator turns down or the GMI goes below 3, I start to become more cautious with my speculative funds. I may raise sell stops, move to cash or go short. At that time I do not move my conservative money out of mutual funds. Only after the GMI has been 1 or 2 for a while and the longer term moving averages curve down do I move my conservative money from mutual funds into money market funds. I tend to exit and reinvest in stages, not all at once. In declining markets, even after I move my conservative monies to a money market fund, I continue putting the new allocations into mutual funds so that the new money dollar cost averages into mutual funds. (My money buys mores shares as the price declines.) I do that with mutual funds, unlike individual stocks, because I am pretty confident the mutual funds will rise again.
Given that explanation, I am pretty much in cash in my margin account. In my IRA, I am also mainly in cash but am short the QQQ by the 3x bearish ETF, SQQQ. I remain fully invested in mutual funds in my university pension. The QQQ short term down-trend completed its 10th day on Friday. If I had been nimble enough to buy SQQQ on the close of the first day of the new short term down-trend I would be up almost 12%. That is difficult to do, however, because on the first day of a new trend one does not usually believe it will last. The GMI, now at 1 (of 6), flashed a buy signal last week but it may reverse to a sell by Monday’s close. Meanwhile, the QQQ short term down-trend shows no signs of weakening. The Worden T2108 is at 52%, well in neutral territory. It would take a serous decline to get T2108 below 10% and into oversold territory. And the daily 10.4 stochastic for the QQQ is at 30, not in oversold territory. Both the SPY and QQQ are below their critical 10 week averages. One positive sign—the put/call ratio was a little over 1.0 on Friday. Readings above 1.0 typically signal too much bearishness and an imminent bounce.

The explanation helps, but it still isn’t clear why with the GMI at 1 and the lightning rod / antenna (don’t know the proper name) shown in red, why the “Current Signal” is a Buy. I looked around the site, and couldn’t find a description or set of rules for the indicators. A section or tap for this would be nice. BTW, I enjoy checking in at your site once in awhile – Great work.
So which account is getting the better return? I suspect the IRA, but you never know!
The rule for GMI based signals: GMI 2 days below 3 = sell; 2 days above 3=buy.
Thanks for the clarification.
The bottom line is: NOBODY knows what to do in a market like this.
What is the rule for the red or green color of the lightning rod / antenna?