All of my market indicators remain positive, reflecting the 6 (of 6) readings for the GMI and the GMI2. 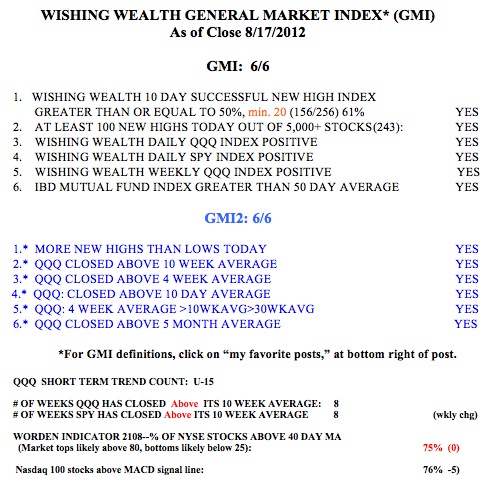 I am not going to discuss the GMI table today because it paints a clear picture. If I look at the market and ignore the news and world developments, it shows a market in a solid up-trend. The QQQ (NASDAQ 100 ETF) remains in an up-trend and the GMI flashed a buy signal as of the close on July 30. Since the close on July 30, the QQQ has advanced +5.4%, the QLD by +10.9% and the TQQQ by +16.9%. As I have said before, the easiest way to ride an up market is to buy one of these leveraged ETF’s when the GMI flashes a buy signal. Of course, I never have the courage to do it right away when it is most scary. I tend to slowly accumulate one of the leveraged ETF’s as the up-trend persists…….
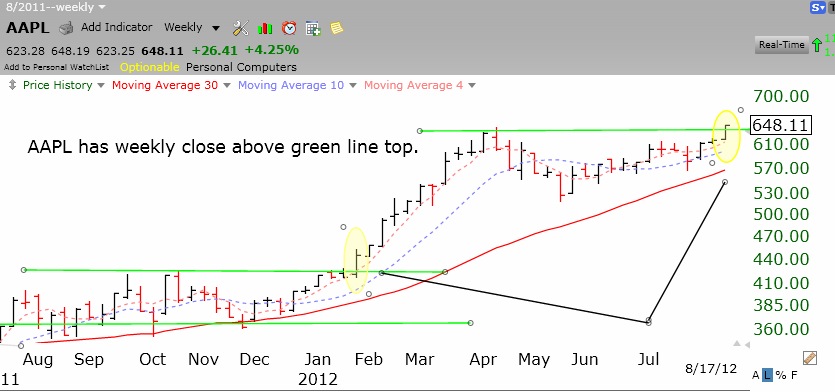
As we all know, a major reason that the QQQ has done so well the past 8 weeks is that AAPL has shined and makes up a large proportion of the NASDAQ 100 Index. Since July 30, AAPL has advanced +8.9%. On Friday, AAPL broke out of a green line top to an all-time high. The weekly chart below clearly shows the current break-out and the similar looking prior one that occurred at the end of January. That rise lasted for 16 weeks and an advance of about +49%, or over $200 per share. There is no telling whether the current breakout will perform as well. But if it did, this rise would last until the end of the year and add on another $300 to AAPL’s stock price. I own some AAPL shares and some deep-in-the-money call options . (Click on chart to enlarge).