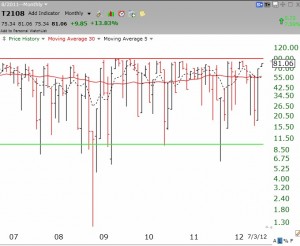
The monthly chart of the T2108 below shows it to be near overbought territory. While the T2108 can stay up there for a while, it is worth noting that this pendulum of the market is close to as high as it ever gets, signified by the horizontal red line. Click on chart to enlarge.

So does this mean that you are pausing from buying more on the long side until the T2108 comes back down? In the past during strong uptrends, there have been periods of near overbought T2108 levels. But sometimes they drop back down while the uptrend continues. Just trying to understand how best to react to a high T2108 reading in an otherwise strong uptrend. Thank you.