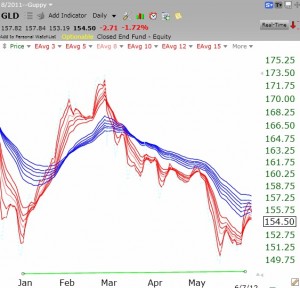
The daily Guppy chart (GMMA) shows that the gold ETF has been in a down-trend. The short-term averages (red) are up against the longer term averages (blue). It remains to be seen whether GLD can break through this resistance around 157-158. The GMMA is composed of 12 exponential moving averages: 3,5,8,10,12,15 and 30,35,40,45,50,60.

Dr. Wish, your PhD is in the field of psychology, so would you agree that investors are now expecting the current correction to end soon. The Market is waiting for an excuse to go up. We, in turn, should be willing to bet that your guppy will break through upwards, as it did in Jan in the chart. If we wait, we miss half of the upward potential gains on individual stocks.
I have learned some painful lessons that it is better to move after the expected signal occurs and not in anticipation of it.
I miss seeing your GMI chart. Where does one go to ascertain the % of NASDAQ 100 stocks above the MACD Signal Line?
I post the GMI chart every Monday morning. The MACD stat is near the bottom of the table.